Everything Rivet does
On your own machine, on your own Mapped data.
Part 1 of 3
Start here
See your site before you build
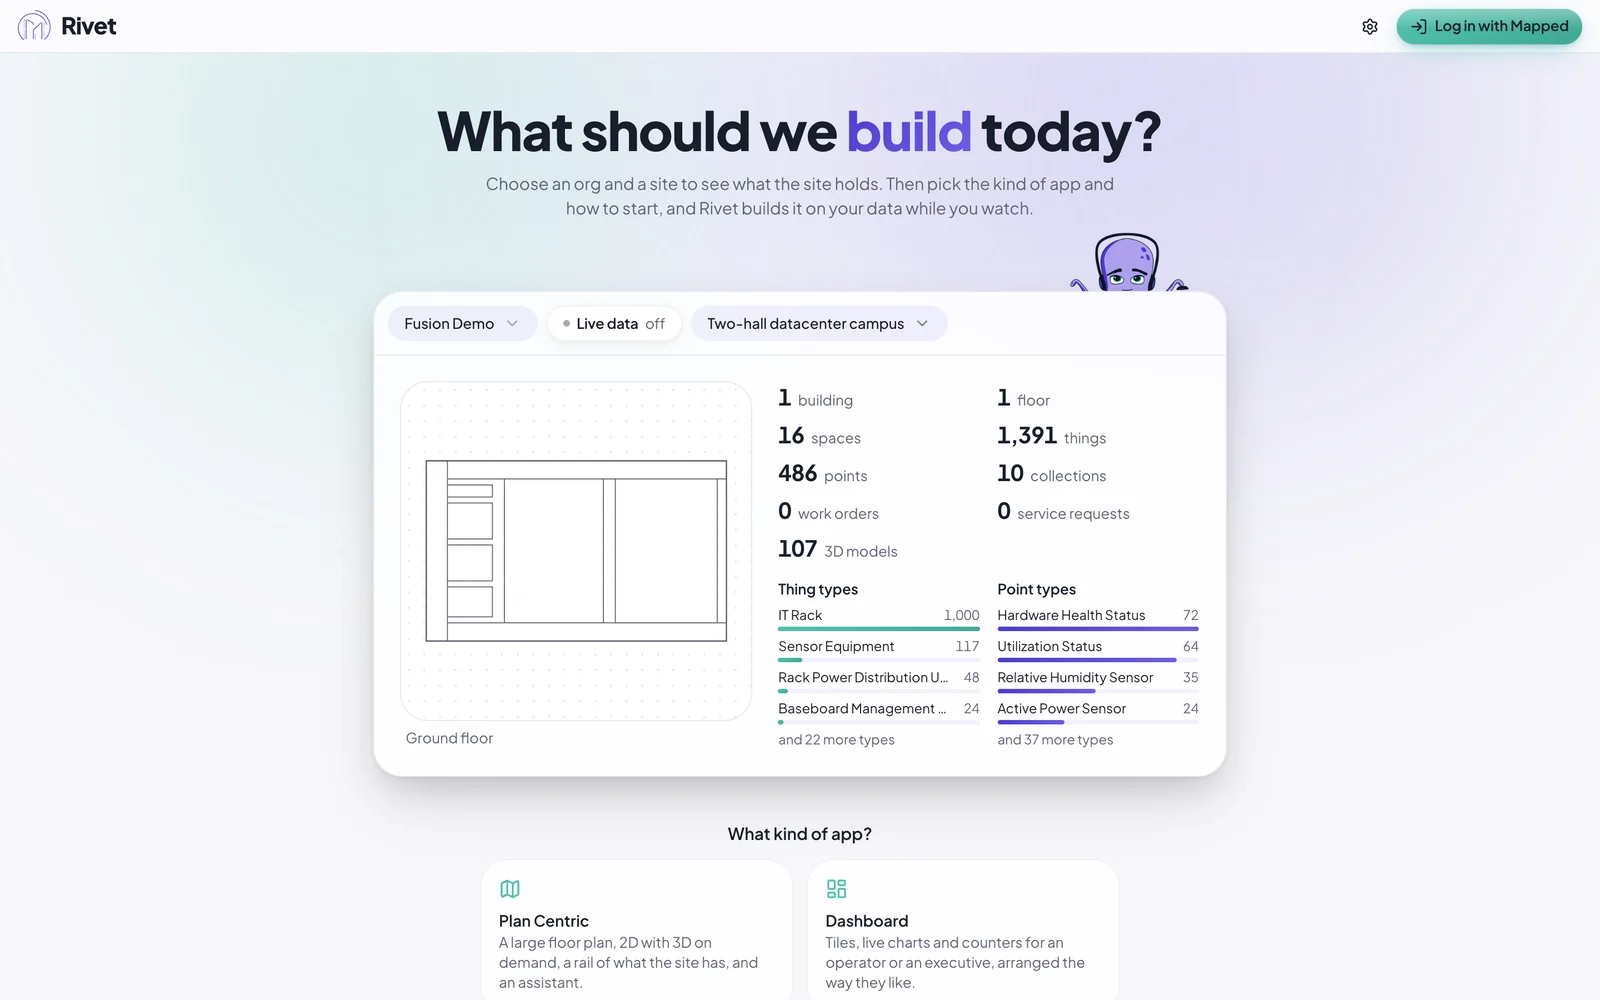
Pick a site and Rivet shows what it holds first: a floor plan beside its counts of spaces, equipment, readings and 3D models.
- Templates and ideas the site can’t support are greyed out, with the reason. The ideas under the description box follow the site too.
- Start from Plan Centric and Open the plan makes a working app at once, with no Claude usage. Nothing is locked in.
- The Fusion Demo says up front it’s example sites, with readings and moving things from Mapped’s simulator.
Build in a conversation
Describe the app. Rivet plans it, picks the points from your Mapped graph, asks what it needs to know, and writes the files.
- Questions come as cards with options, never a form.
- Every run shows its agents and their steps. Developer mode adds the model, the files and the cost.
- Stop ends a run. Undo steps back to before it.

It knows who it is for
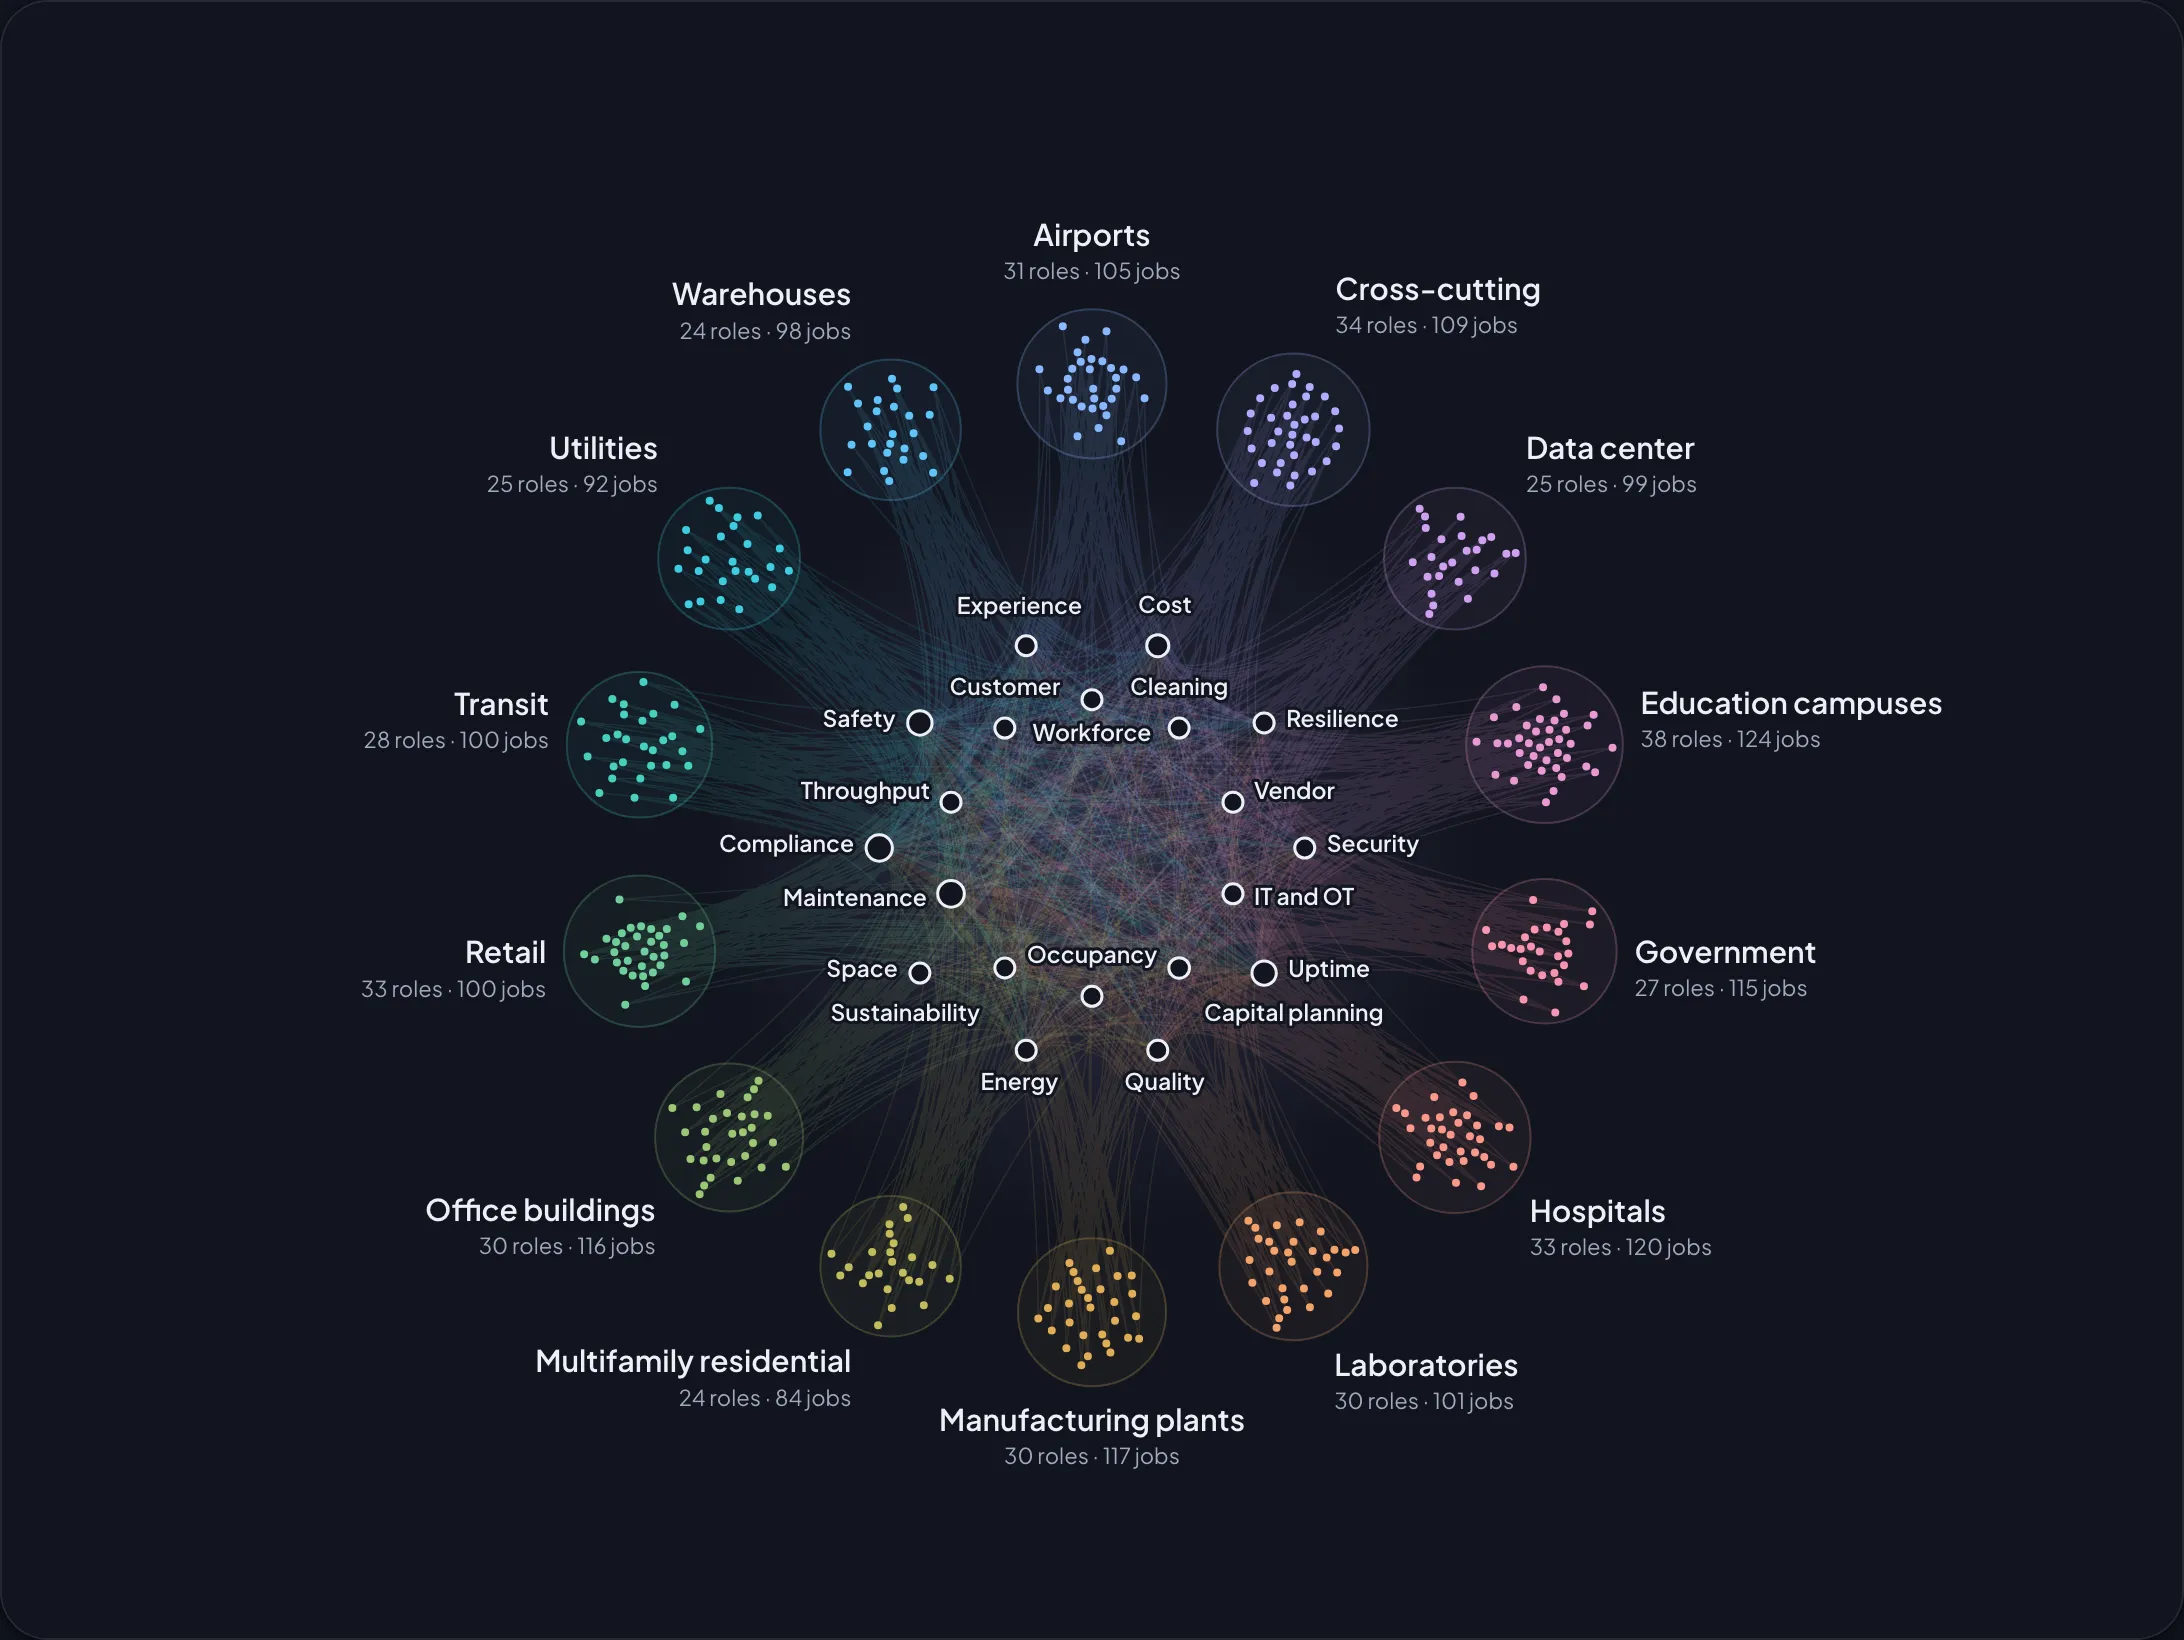
Say who the app is for. Rivet looks the role up in PersonaDB, 412 roles and 1,480 jobs across 14 kinds of facility, and builds around their jobs.
- Pick a role, from an airport duty manager to a sustainability manager, then the jobs they need done.
- A role that isn’t listed works too: describe it.
- Every entry is cited or marked inferred. See every persona
Everything is code
Every app is files you can read, change and keep.
- An app is a folder of React, TypeScript and JSON. Open it in your own editor or Claude Code.
Single-player, for now
Today your apps run in Rivet, on your computer. Sharing them is next.
- Why: Rivet is in beta, and we're collecting feedback before we open up sharing.
- Coming Export an app as a standalone desktop app, for people who don't have Rivet.
- Coming Export an app as a Docker image you can deploy to hundreds of hosting sites with a single click.
Your real Mapped data
Apps run on your organisation’s real graph and live readings, through your own Mapped token.
- Rivet reads your site and never writes to it or sends commands to equipment.
- Each tile can show where its data comes from.
- An app reads one site at a time. Name another site in the chat and Rivet moves the app there.
Where your data goes
Every place Rivet sends anything.
| Where | What goes there |
|---|---|
| Mapped (api.mapped.com, the live stream and sign-in) | Your site's graph and readings, and your sign-in. Read-only. |
| The model you chose to build with: your Anthropic API key, or the Claude Code on your machine | What you type and the parts of your graph Rivet reads, under your Anthropic plan's terms. |
| Mapped's Rivet service (rivet.mapped.com) | PersonaDB lookups and sign-in. No app data. |
| Rivet Cloud (rivet.mapped.com), only when you publish | The app's image. No tokens or readings. |
| Rivet Cloud (rivet.mapped.com), only if you share usage analytics | Which features you use, with build times, costs and errors by kind, and your Mapped user and org. No project contents, prompts or credentials. |
| Pages you approve | Shown in an embed tile, never read. |
- Nowhere else: no analytics vendor, no crash reports, no automatic updates.
- Apps run in a sandboxed frame with no access to your files or the internet.
- Tokens are sealed in your keychain. The model can only read from Mapped, never write.
Part 2 of 3
Your site, live
See it as it happens
With Mapped’s live stream, the app changes as readings arrive. One dialog installs the stream if your org doesn’t have it.
- Tiles update as readings arrive, without polling Mapped.
- Forklifts, robots and people move on the plan and in 3D, and fade when they go quiet.
- Turn live data off when your network is tight.
Your site in 2D and 3D
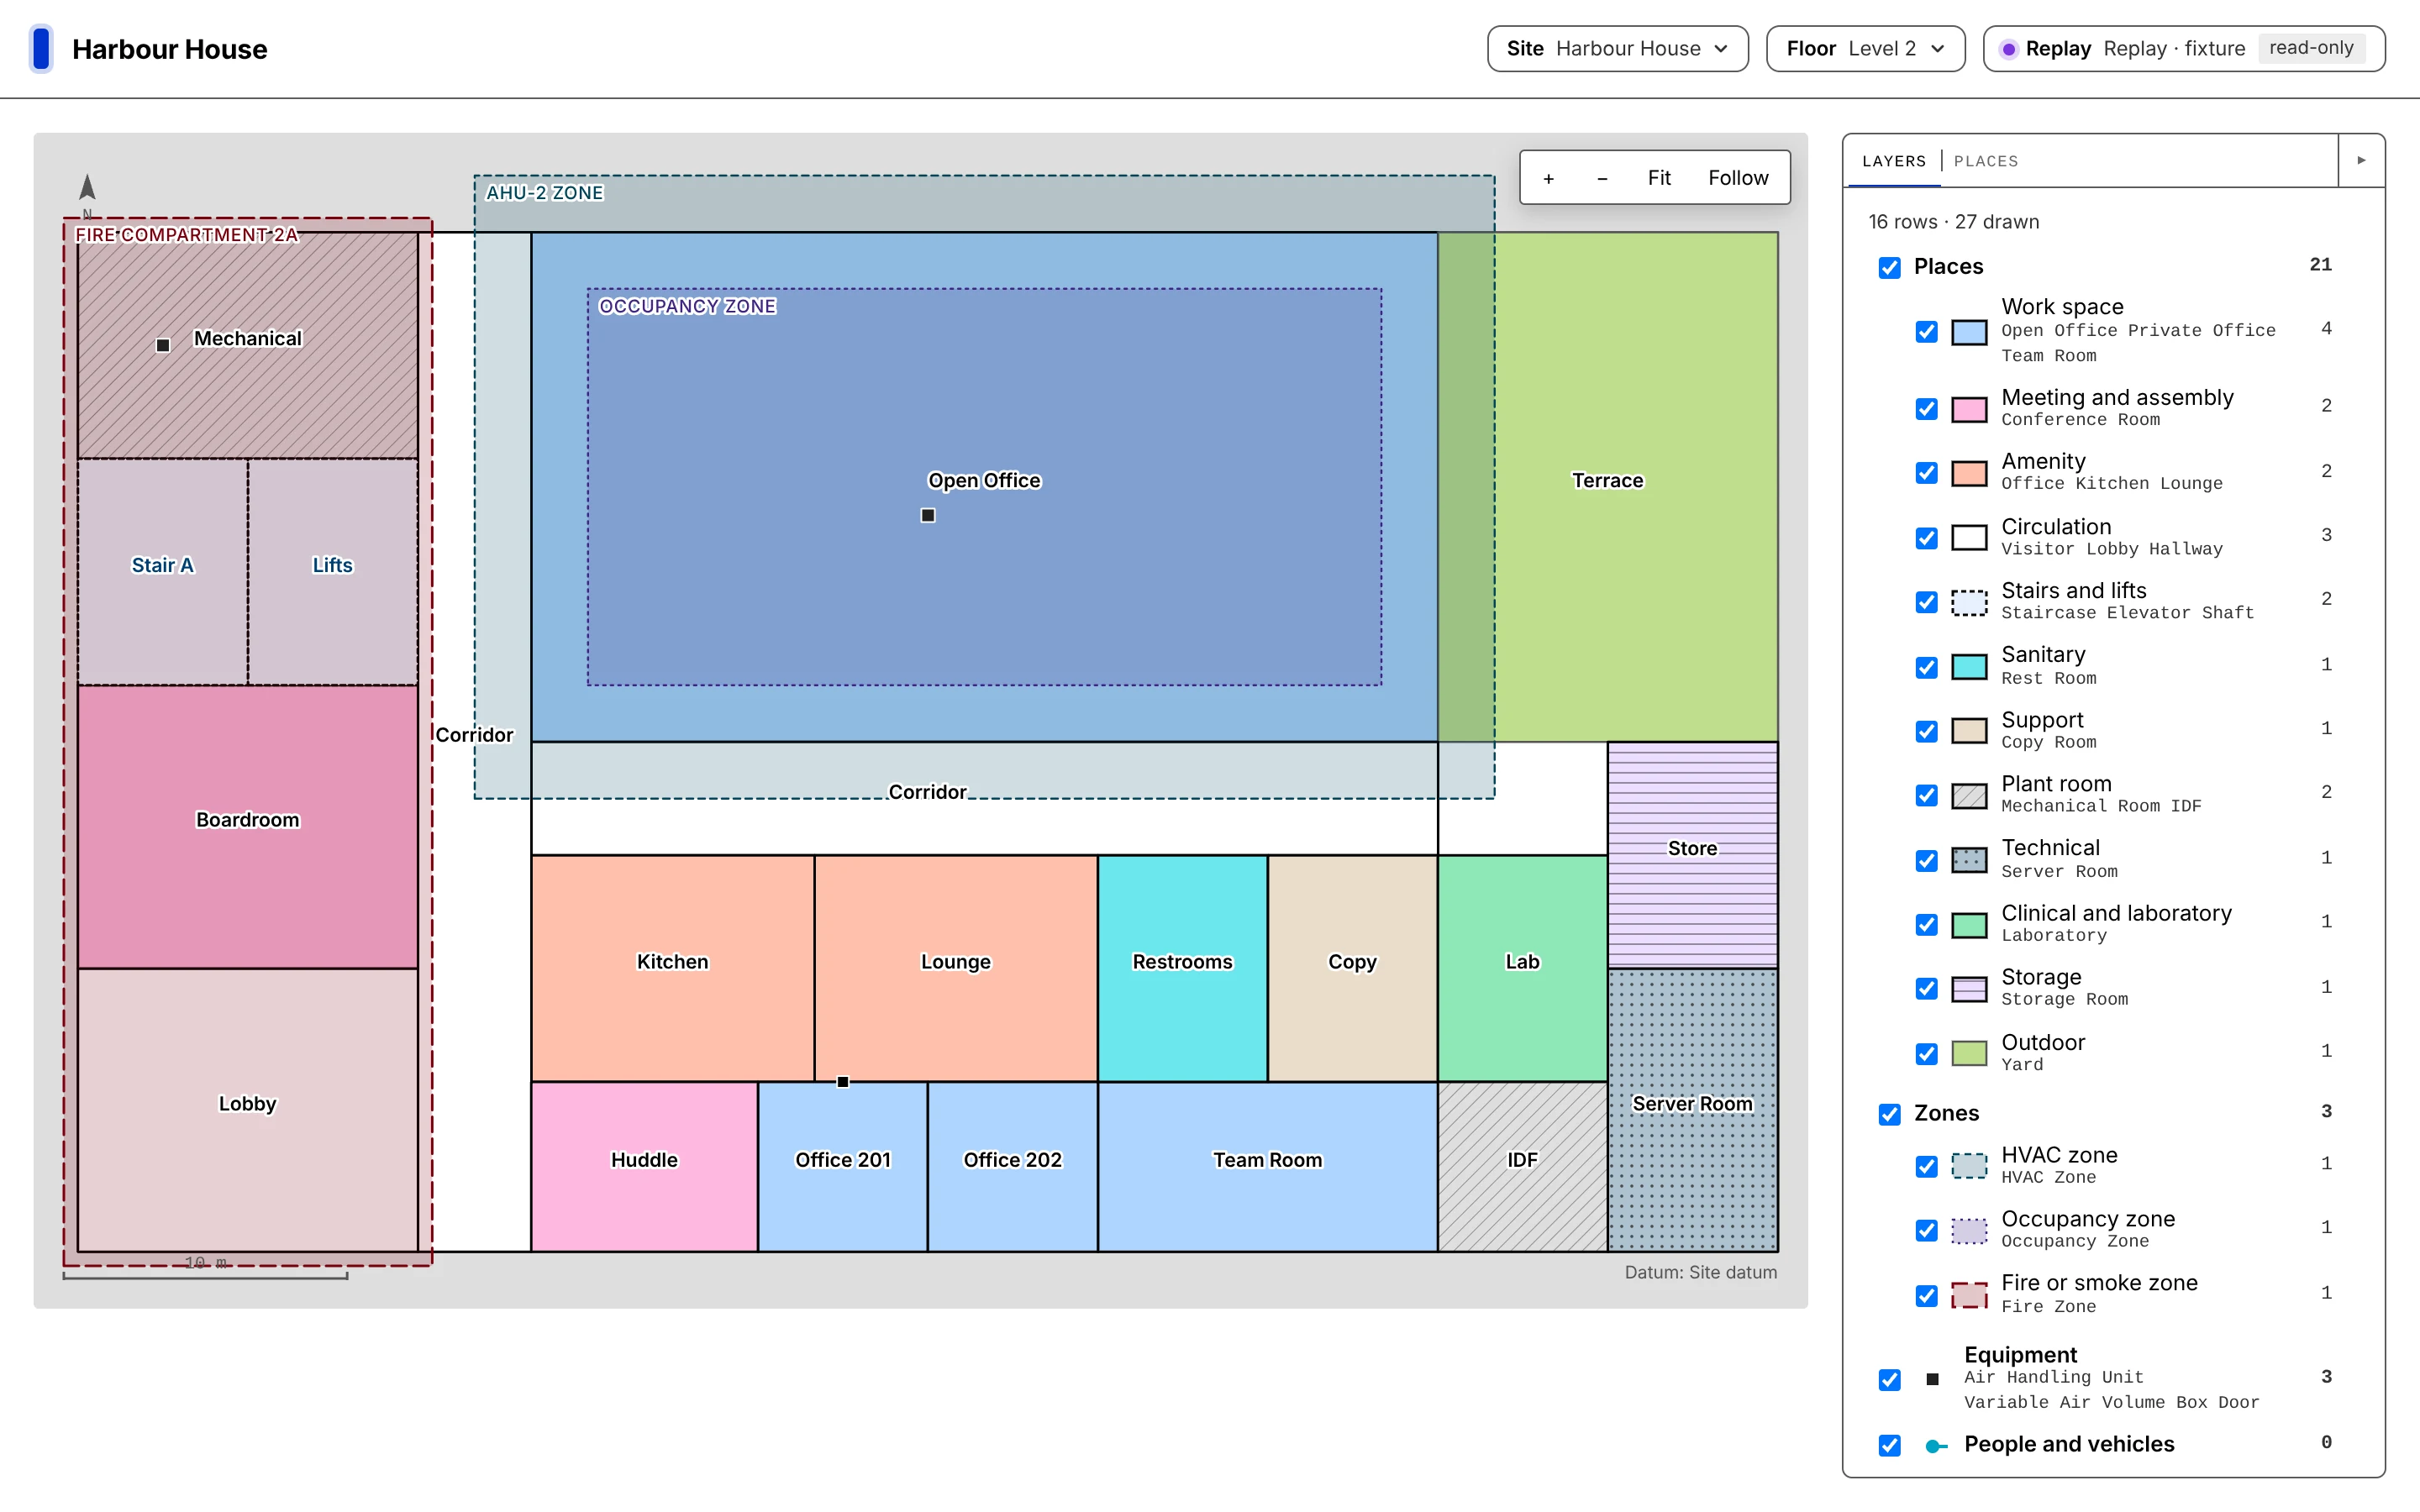
Plans and 3D views come from your site’s own geometry and read like an architect’s drawing, every space coloured by what it’s for.
- Line weights and hatches follow drafting standards, with light, dark and high-contrast looks.
- The Layers panel is the key: hide a kind of space and it disappears in 2D and 3D.
- In 3D, Chase follows a forklift, Navigate drives across the floor, and cards show each thing’s speed and status.
Look back in time
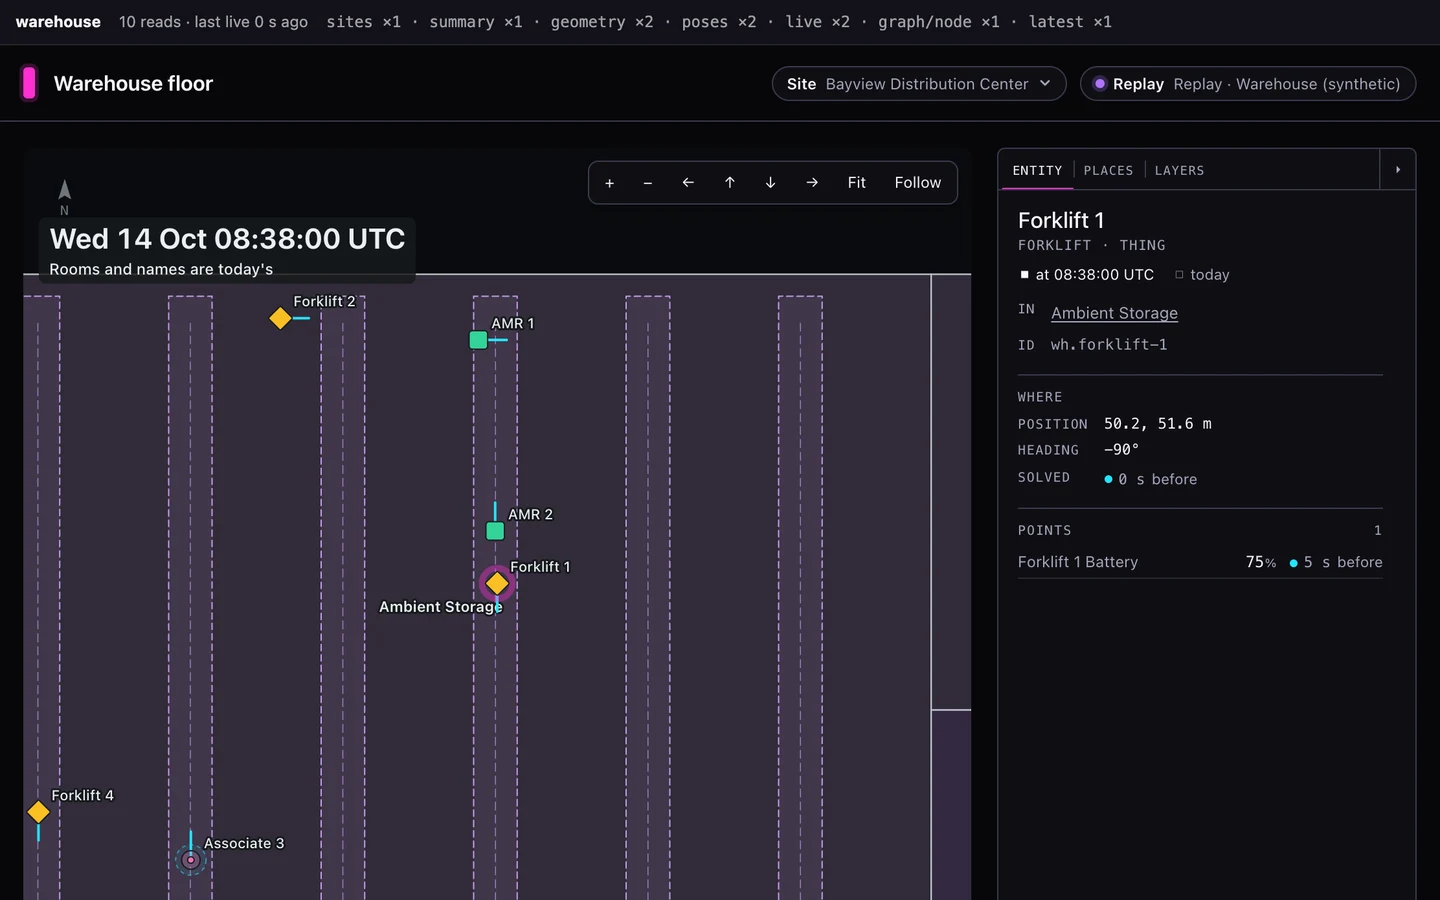
Move a plan back to any moment and see where everything was.
- Rooms and names are today’s, and the app says so.
- On a dashboard, one plan tile can look back while the rest stay put.
Find what happened at the same moment
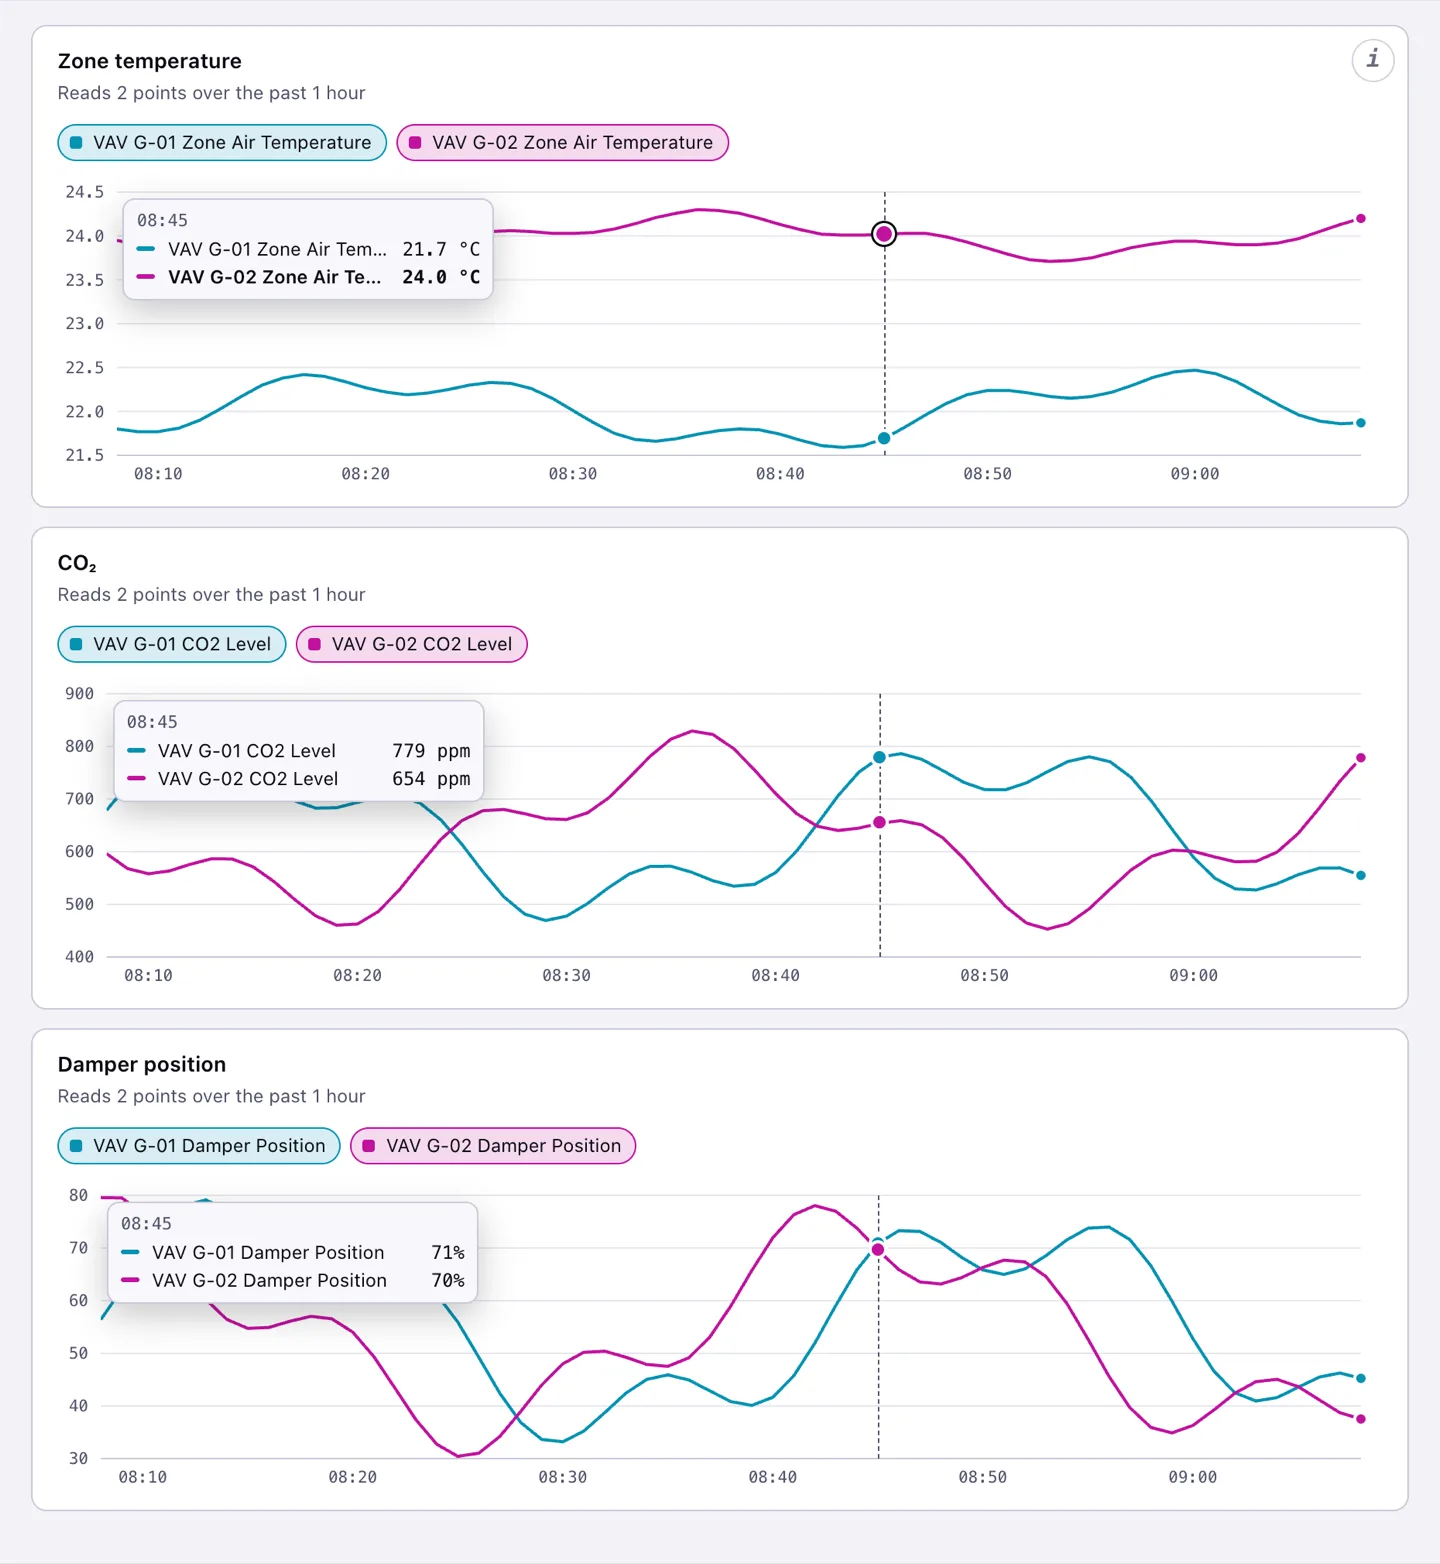
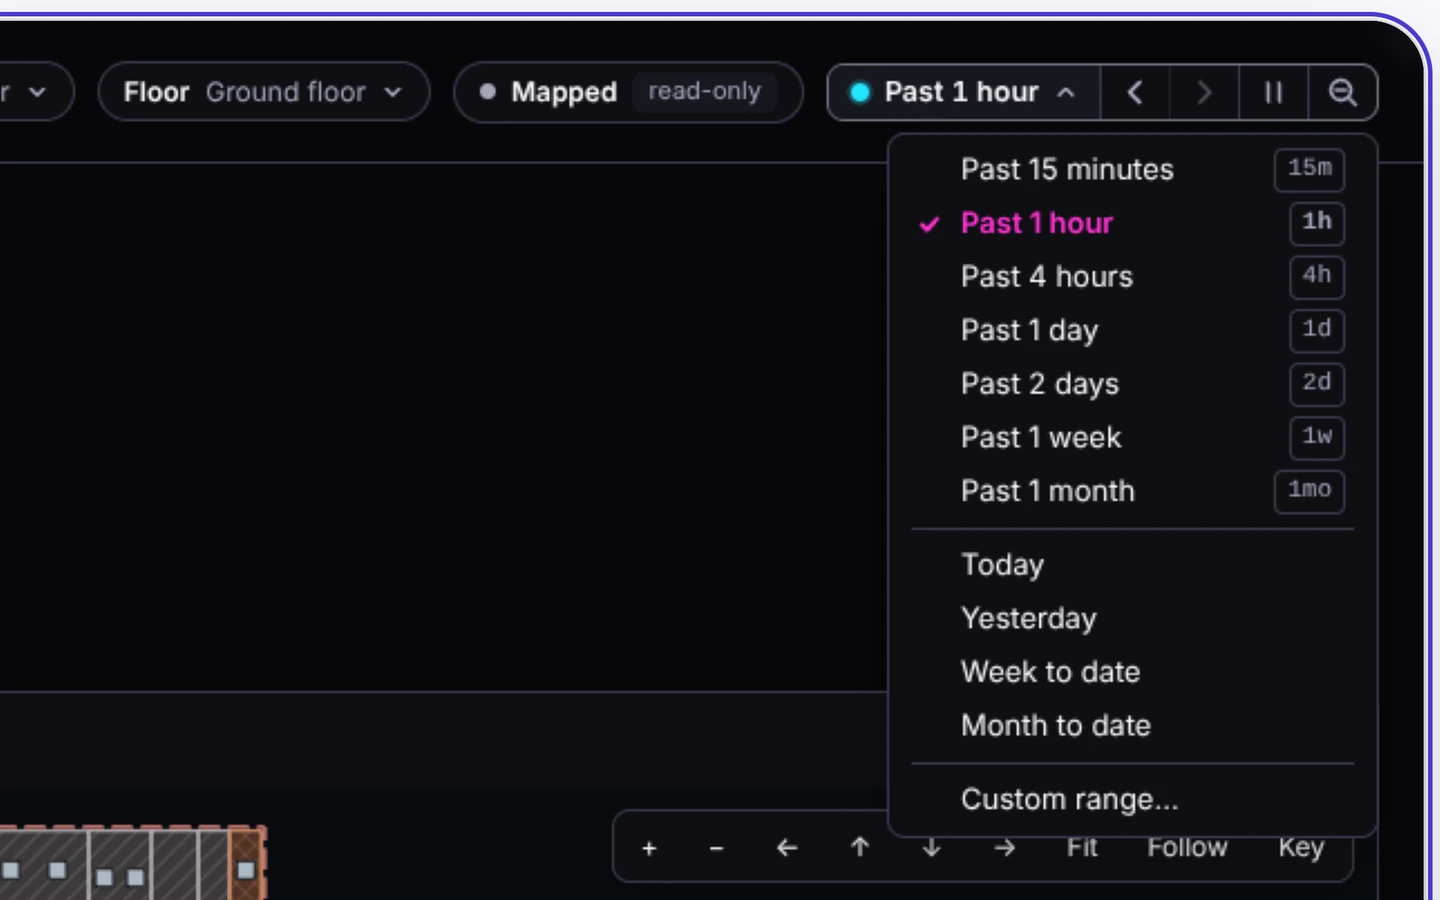
Point at a moment on one chart and every chart shows what it read then. Drag to zoom the whole board.
- On a phone, drag a finger along a chart to read it.
- Or type any window in the past, up to 92 days.
An assistant on any app
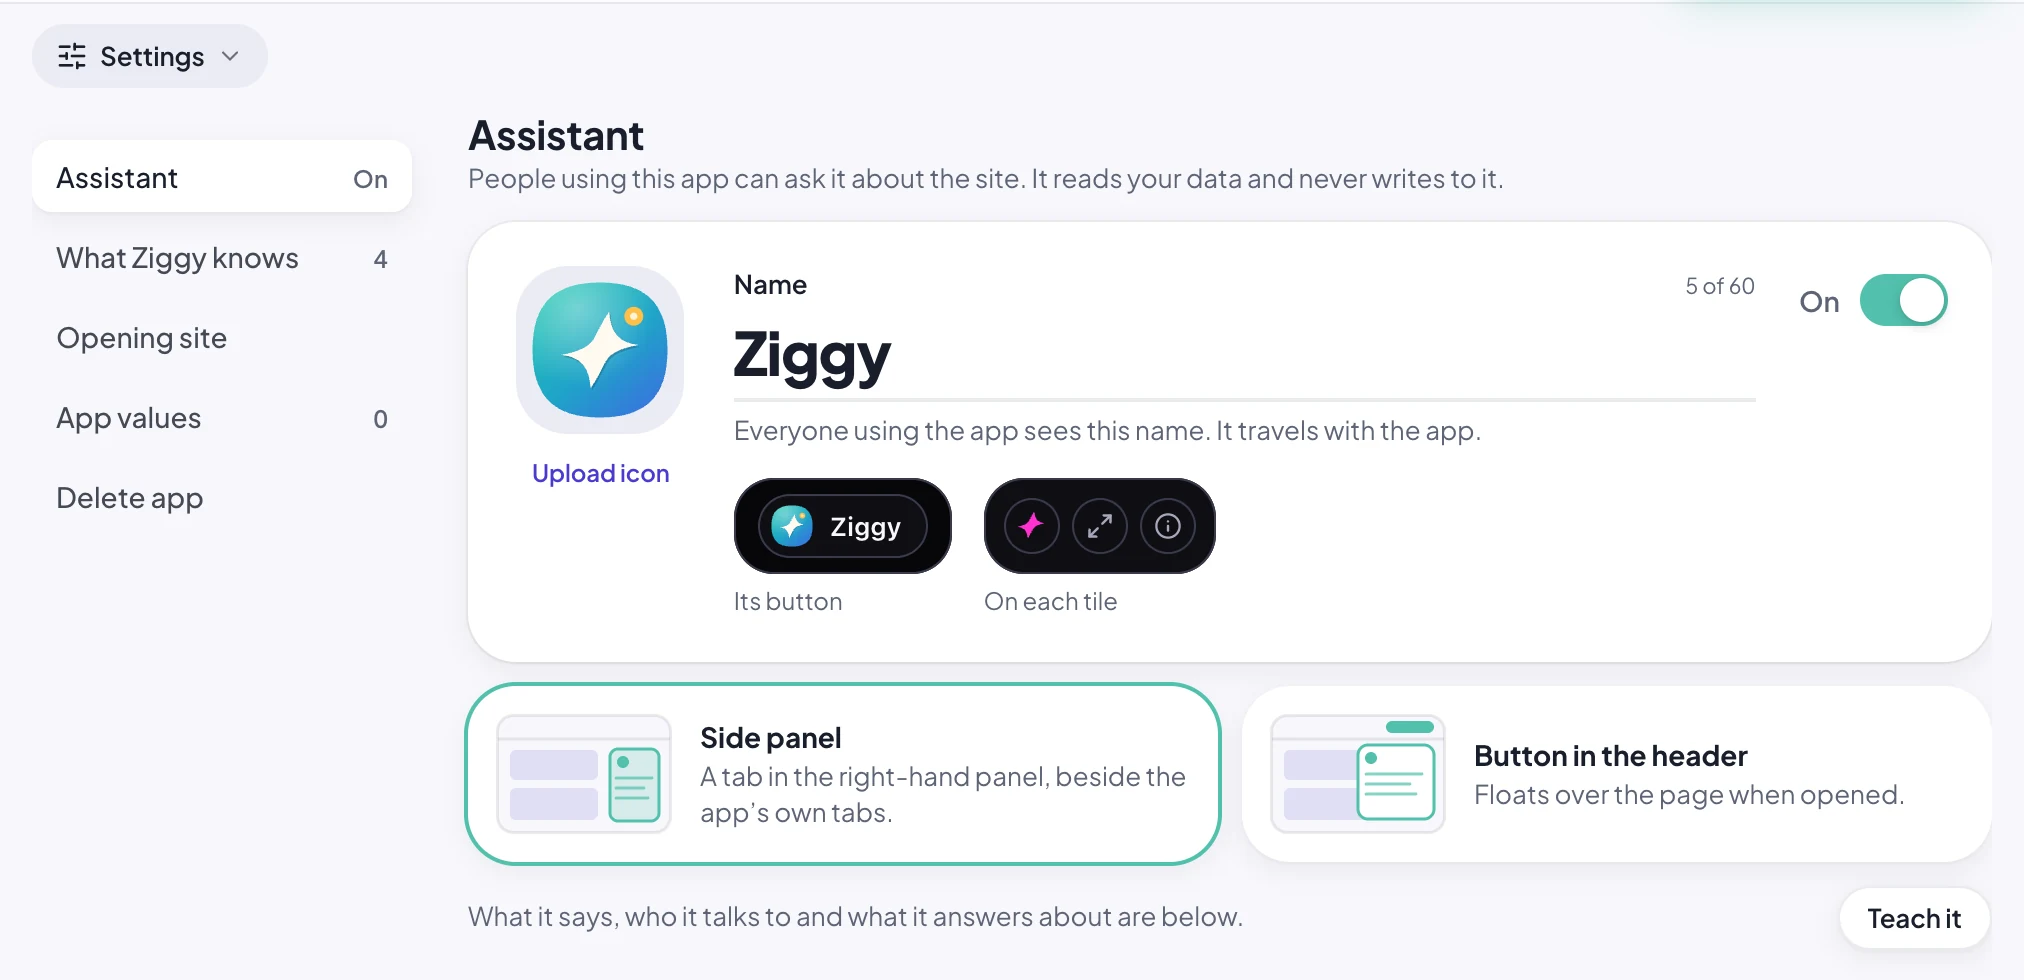
Switch on an assistant in Settings and the people using the app can ask about the site. It’s Ziggy until you name it.
- It reads the tiles on screen and on the app’s other pages, so “what needs attention?” is answered from your board.
- Ask about one tile with the ✦ in its corner.
- Teach it what to answer. It never writes to Mapped.
Part 3 of 3
Make it yours
Follow up in plain words
Type what you want changed. Small edits land in seconds; bigger ones go to Rivet.
- Compile errors get fixed without you asking.
- The preview reloads as the files land.
Choose the model and the effort
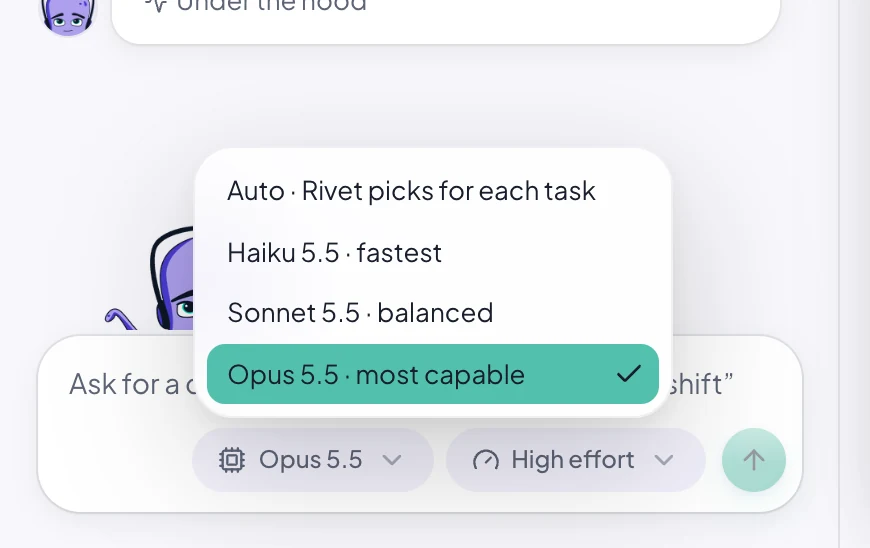
Rivet picks the fastest model for each task, or you choose the model and effort per app.
- Change it any time beside Send.
- Your choice covers every helper, so nothing moves to a bigger model behind your back.
Edit text, Inspect, Theme
Three toolbar tools change the app with no model call.
- Edit text: retype any word on screen.
- Inspect: point at a thing so “make this red” means that thing.
- Theme: presets, colours, fonts and density, with a contrast readout.

Room to work
Switch apps from the cover, give the preview the whole window, and turn off any tool you don’t want Rivet to use.
An app in pages
Split an app into pages, an overview, energy, safety, listed down the side, each with an icon and its own link.
- Fold the list to a strip of icons. On a phone it’s a menu.
- A page can open on its own time range or site.
- A count beside a page’s title says what needs attention there.
2 more
- Add a page yourself with New page: pick Plan Centric, Dashboard or Blank, and it’s there at once, for Rivet to fill when you ask.
- Ask Rivet to add, rename, reorder or remove pages, and pick their icons in the chat.
Tiles for any operation
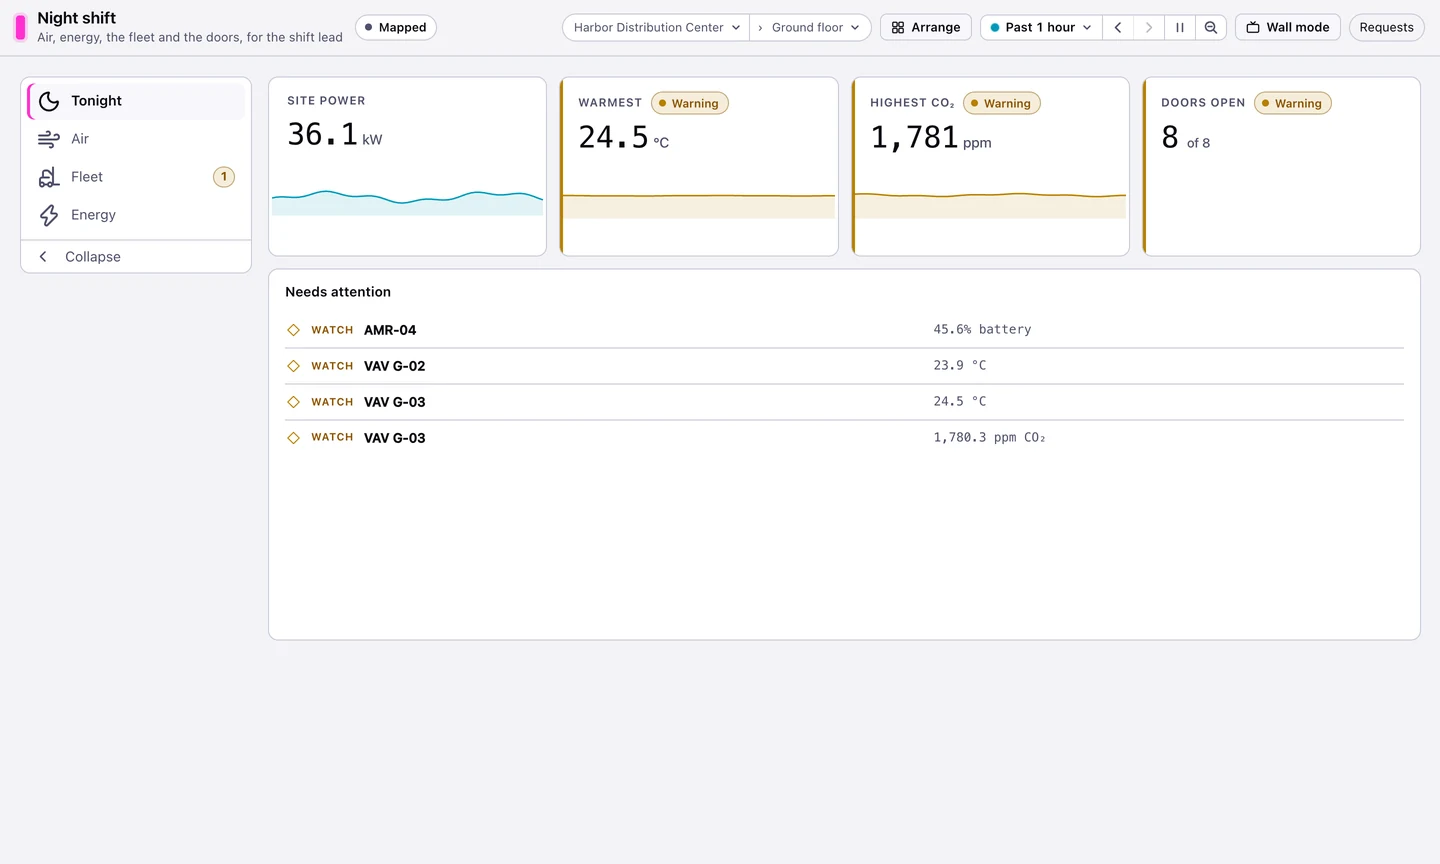
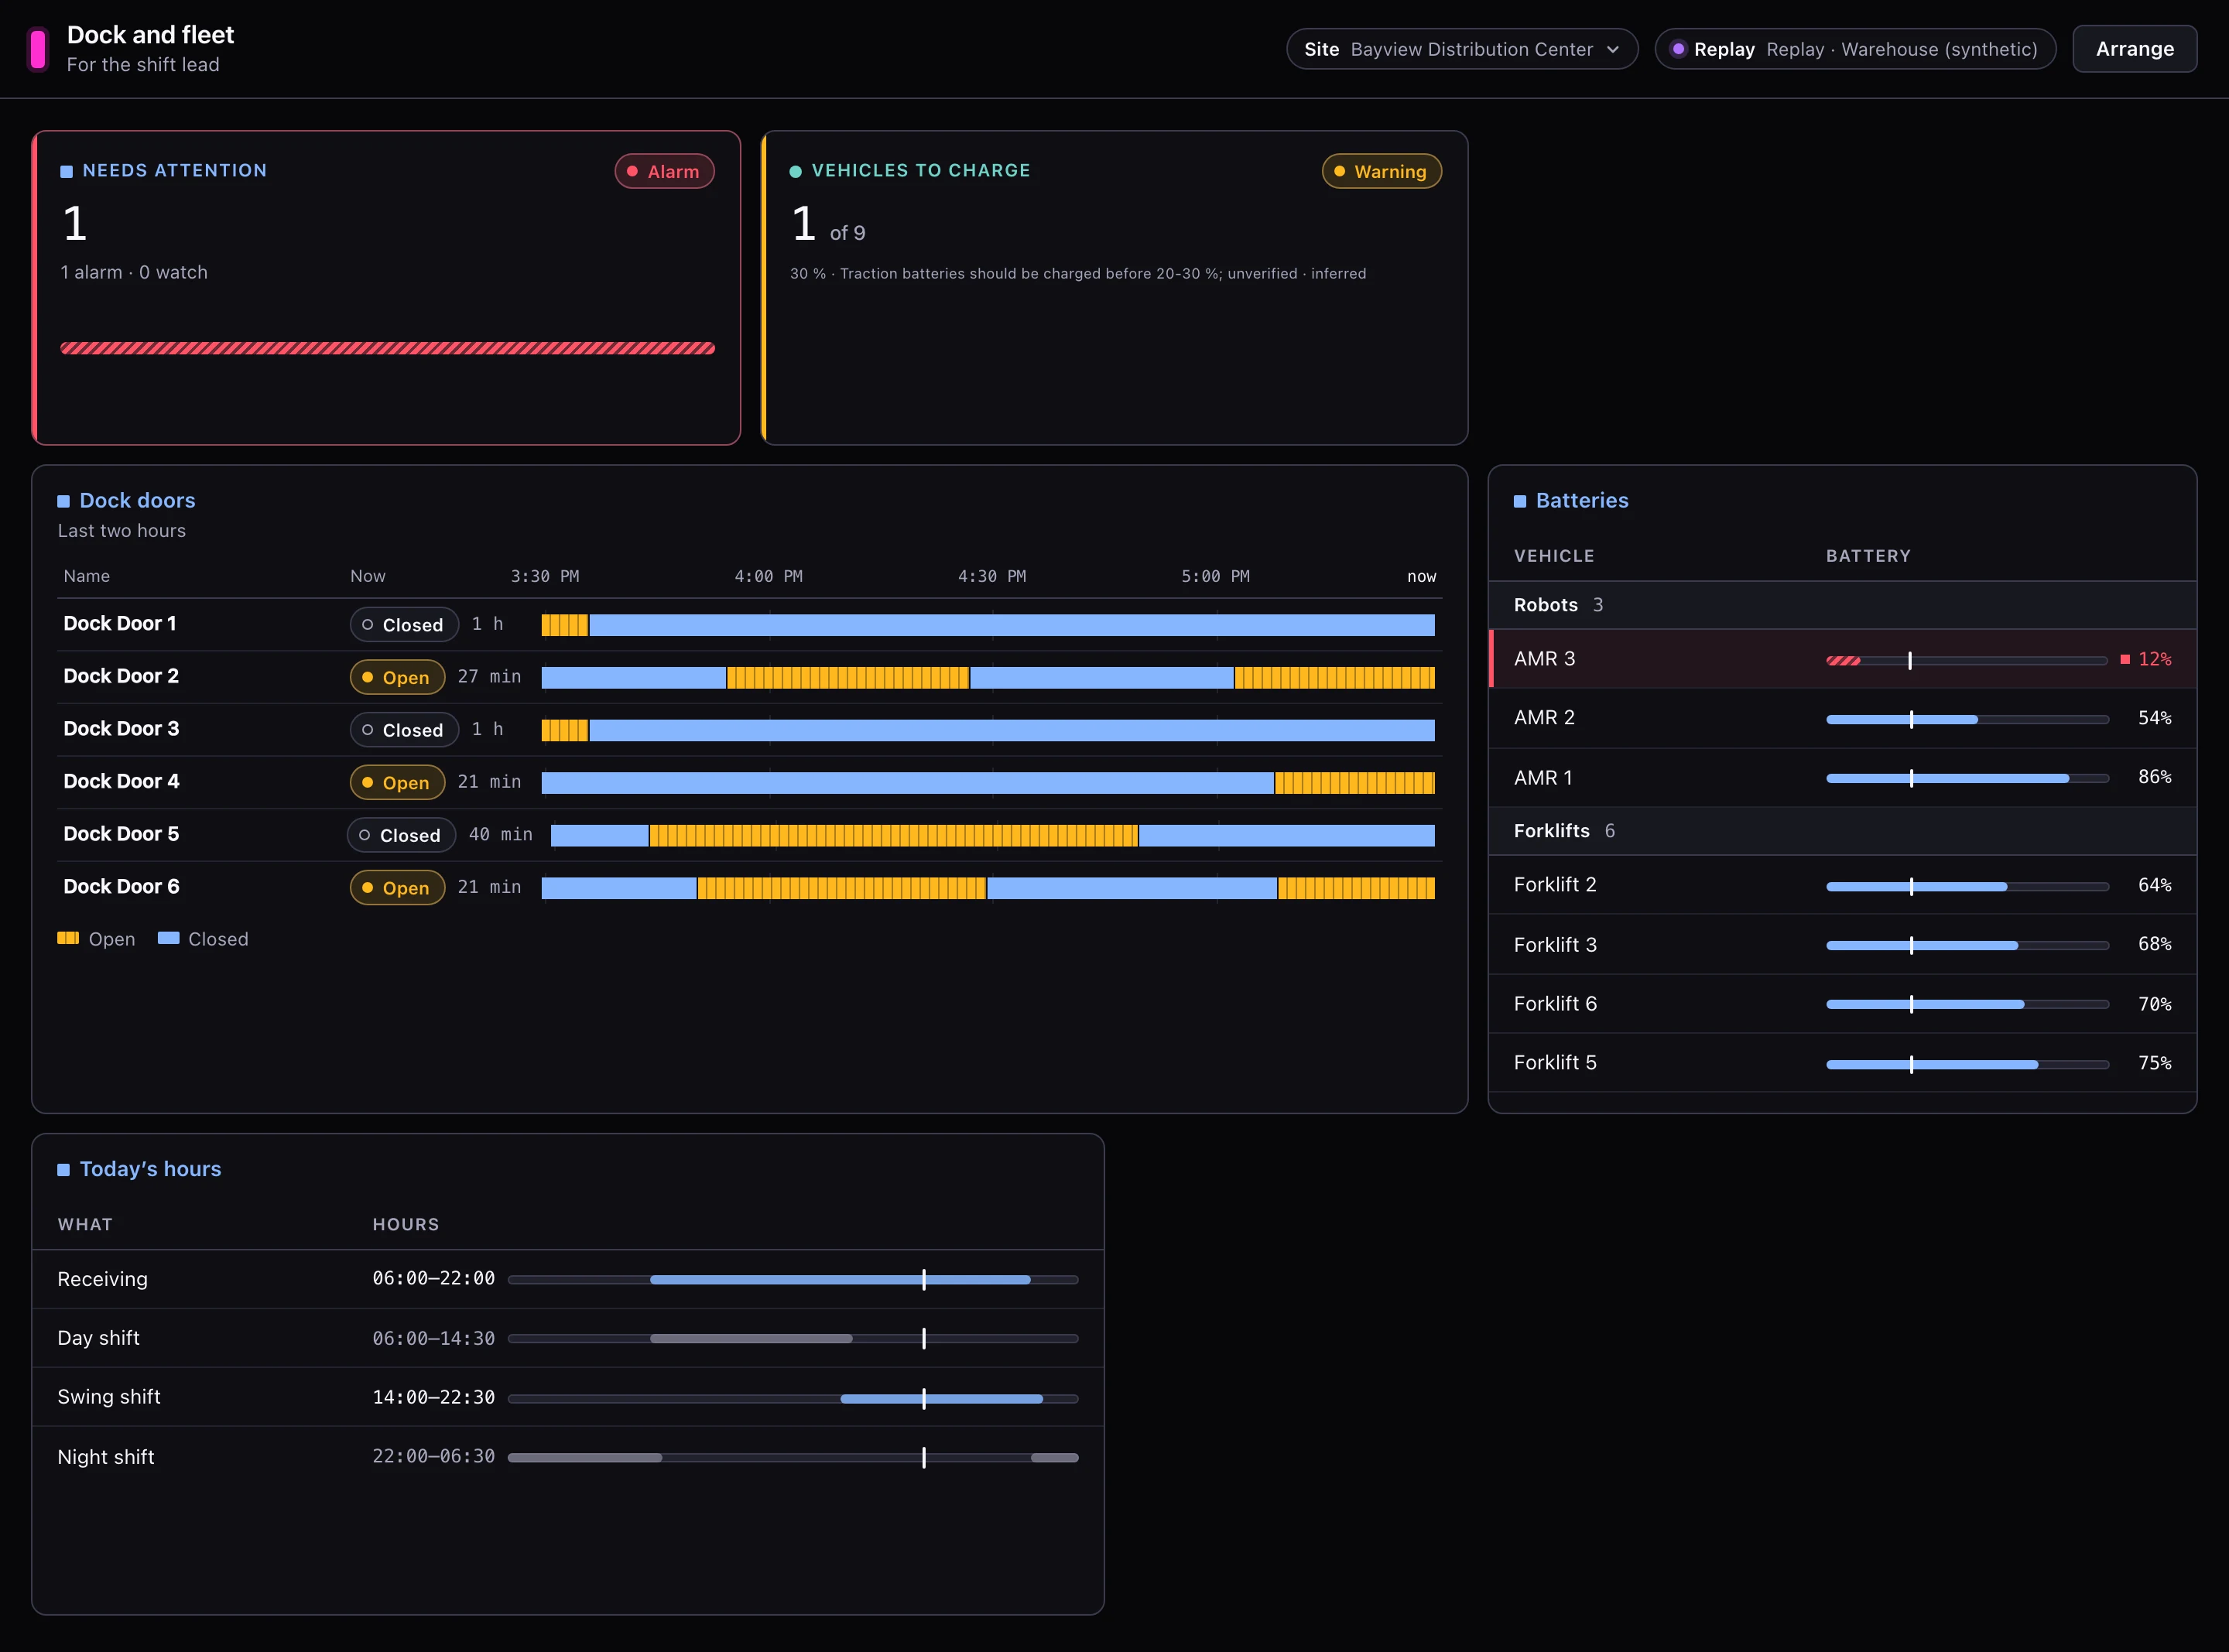
Every board is built from the same general tiles: a gate board and a fleet list are one set of pieces.
- Tables with meters, timelines of doors and machines, spreads against a comfort band.
- Targets and bands come from your data or settings, never the code.
- Every tile works with a keyboard and a screen reader.
Dashboards you can shape yourself
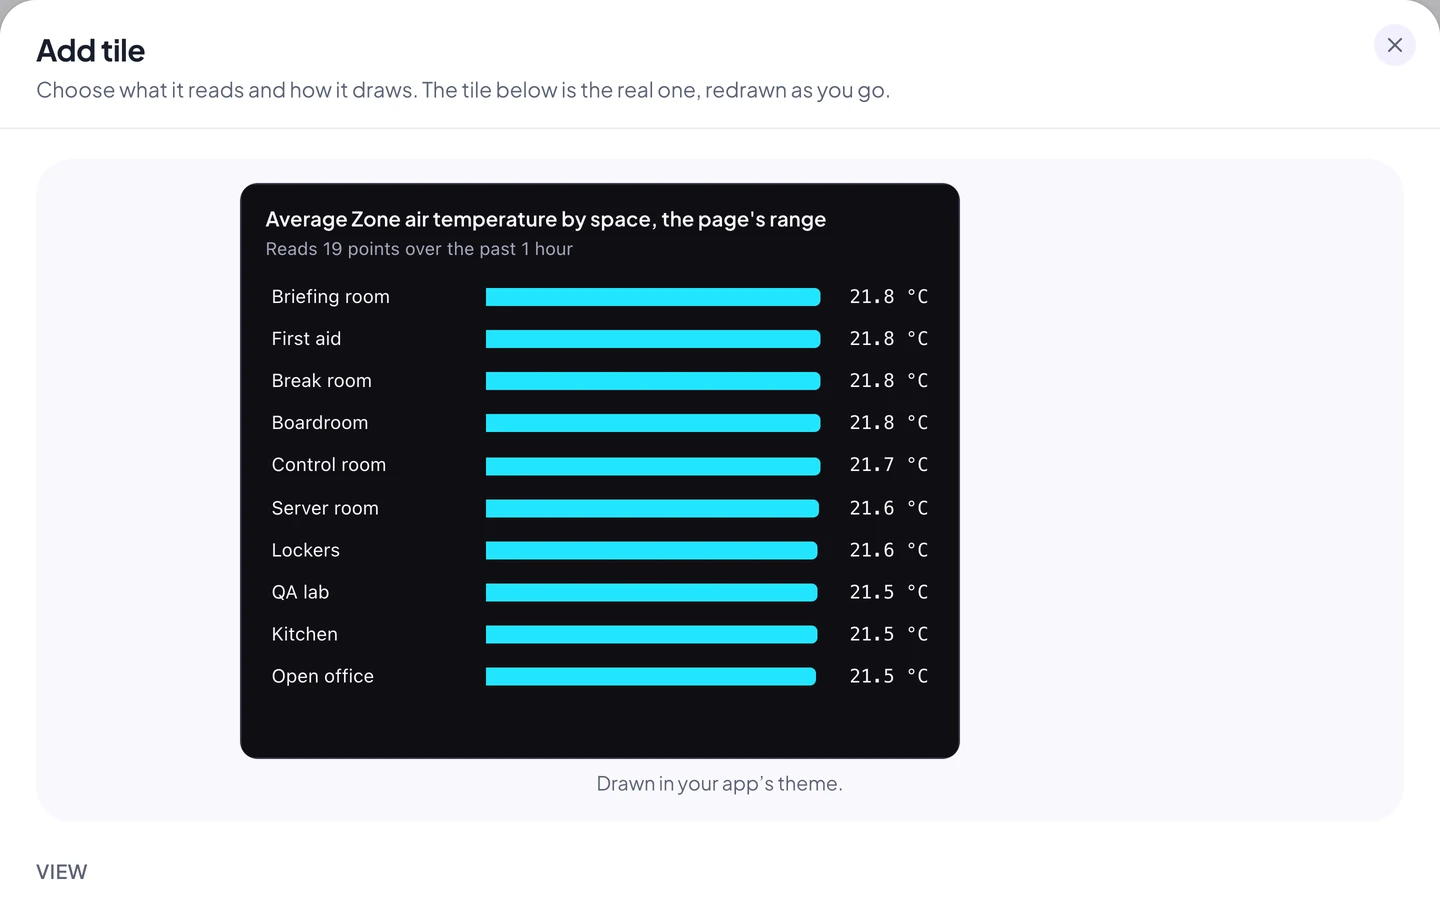
Add and change tiles yourself, without asking Rivet.
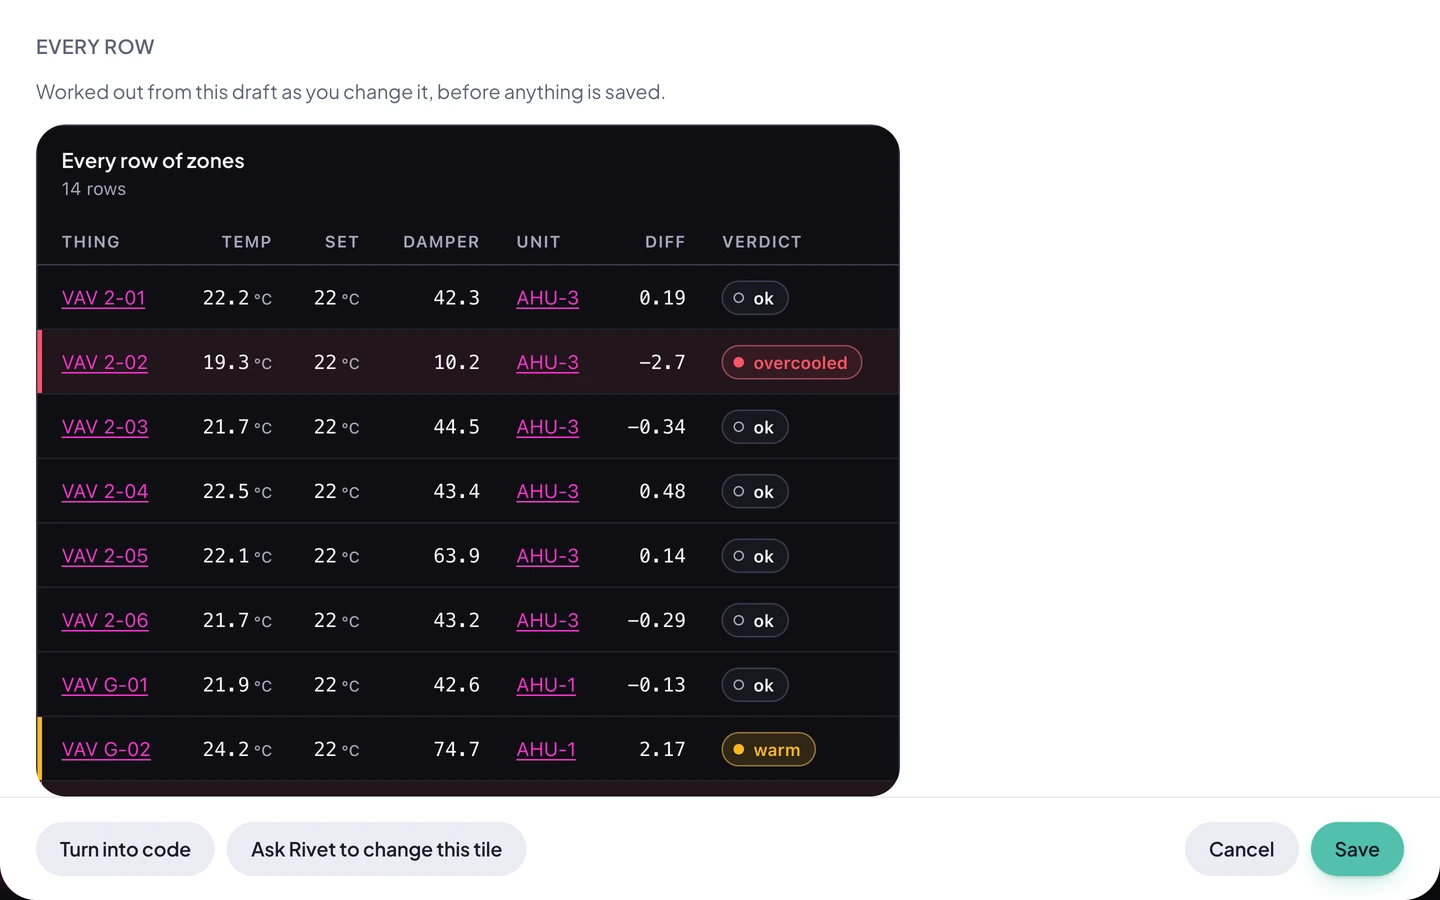
Write a rule once. Every tile obeys it.
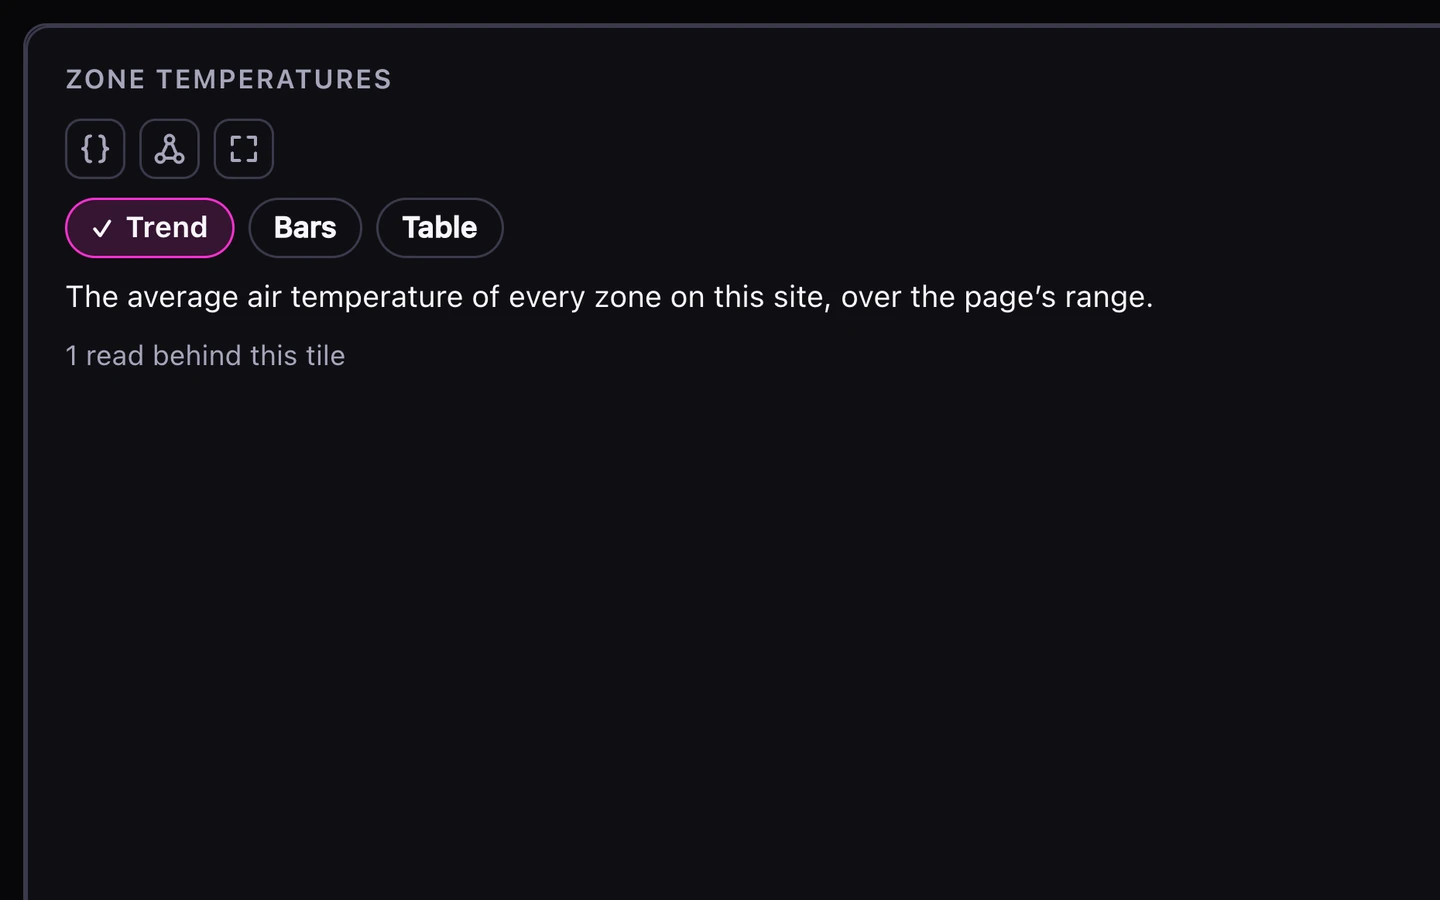
Describe a table of your equipment once, with its readings and verdicts, and every tile on the board reads it.
- Verdicts such as starved or overcooled come from rules that read the app’s settings.
- Tables follow any relationship in your Mapped graph, and work orders can be rows.
- Rivet asks before it makes a tile specially for you, and says what it would cost.
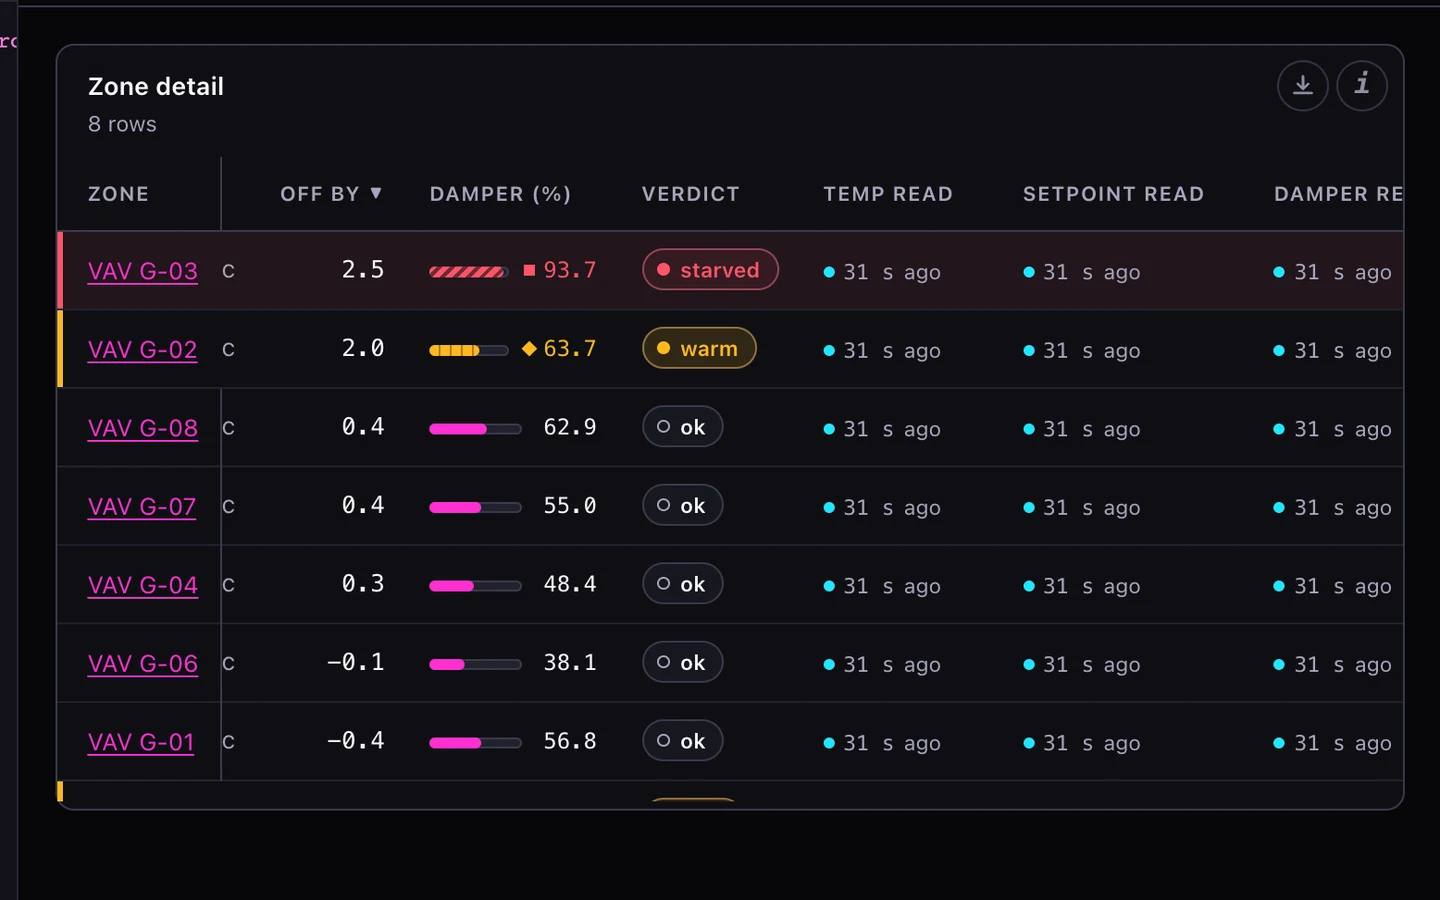
Tables you can work in
Pin a column, sort by any header, and download the rows as a spreadsheet.
- Sorting stays live as readings arrive.
- Your sort is remembered on your device.
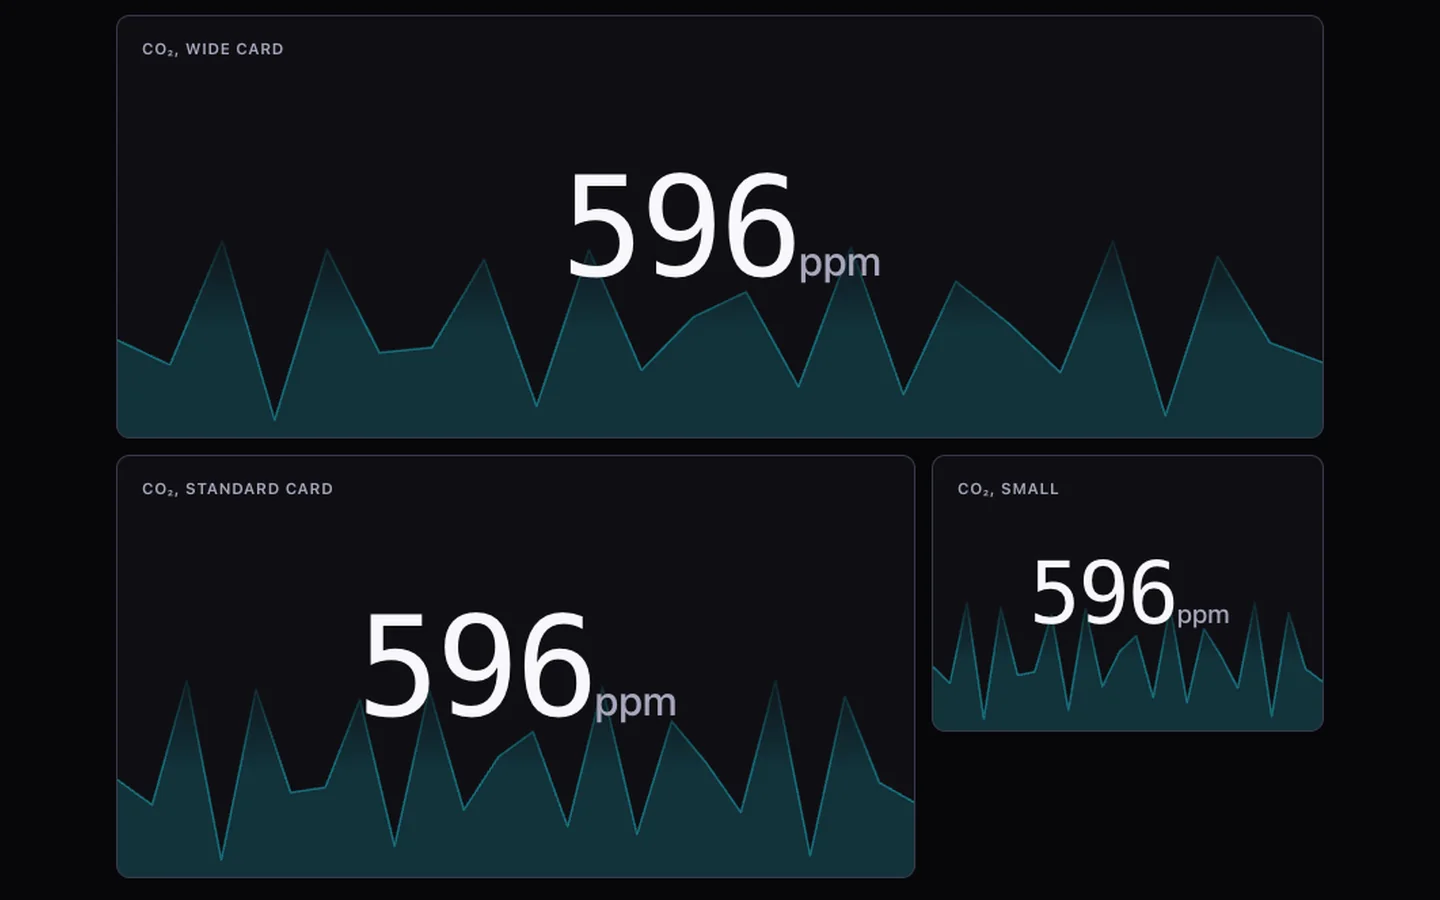
The number that matters, with its trend behind it
Put the key figure large in its card, with the last hours drawn quietly behind it.
- The figure sizes itself to the card.
- The trend takes the tile’s alarm colour.
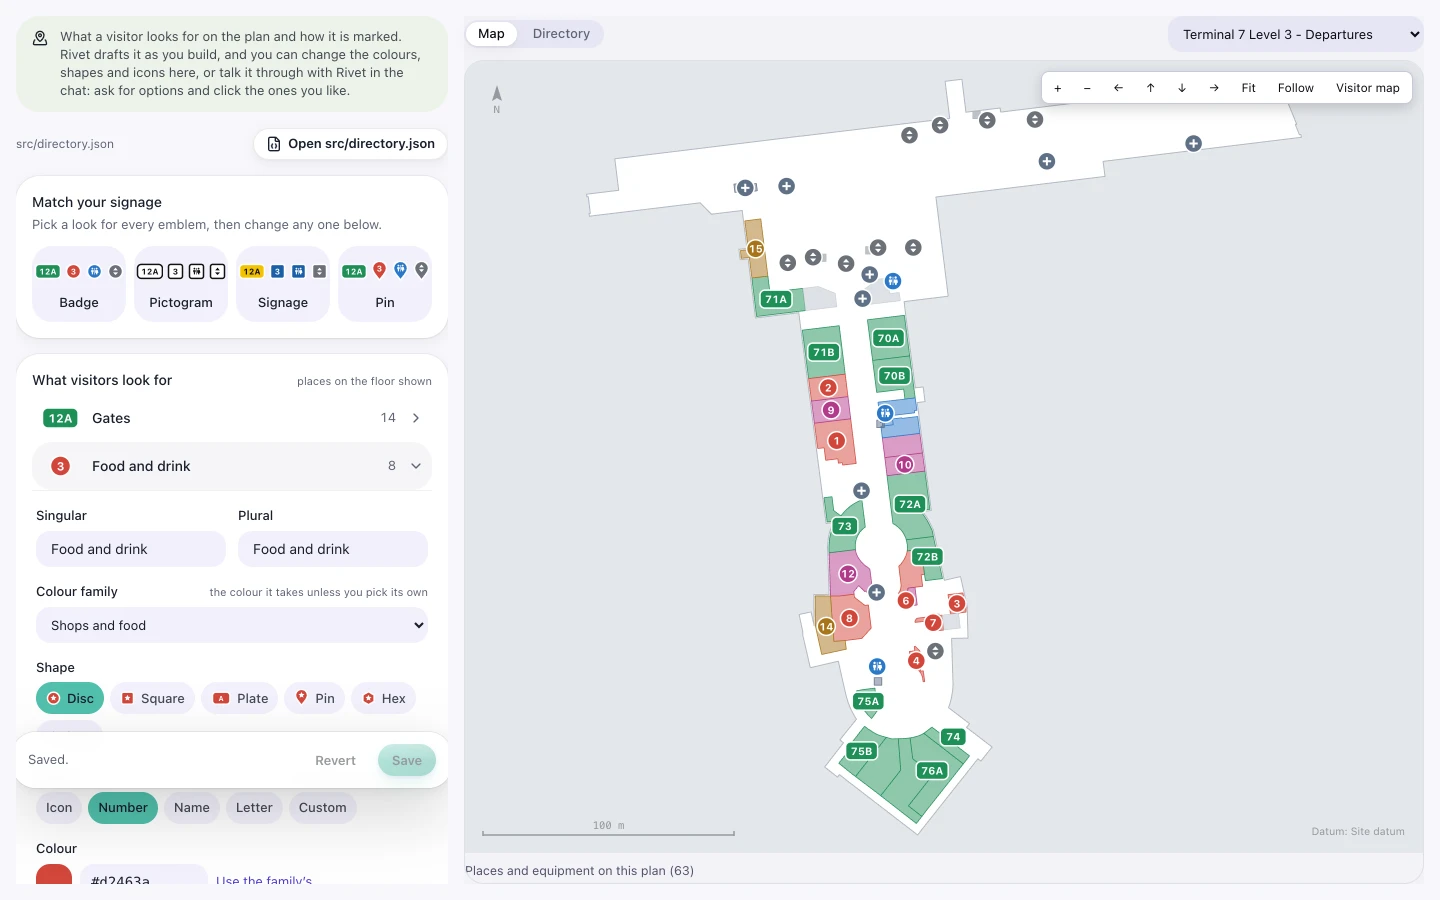
A map for visitors
Draw the plan the way a terminal map reads, with gates, food and restrooms in a numbered directory.
- Rivet drafts it from what each space is, and lists what it couldn’t place.
- Change shapes, icons and colours, or match your signage in one press.
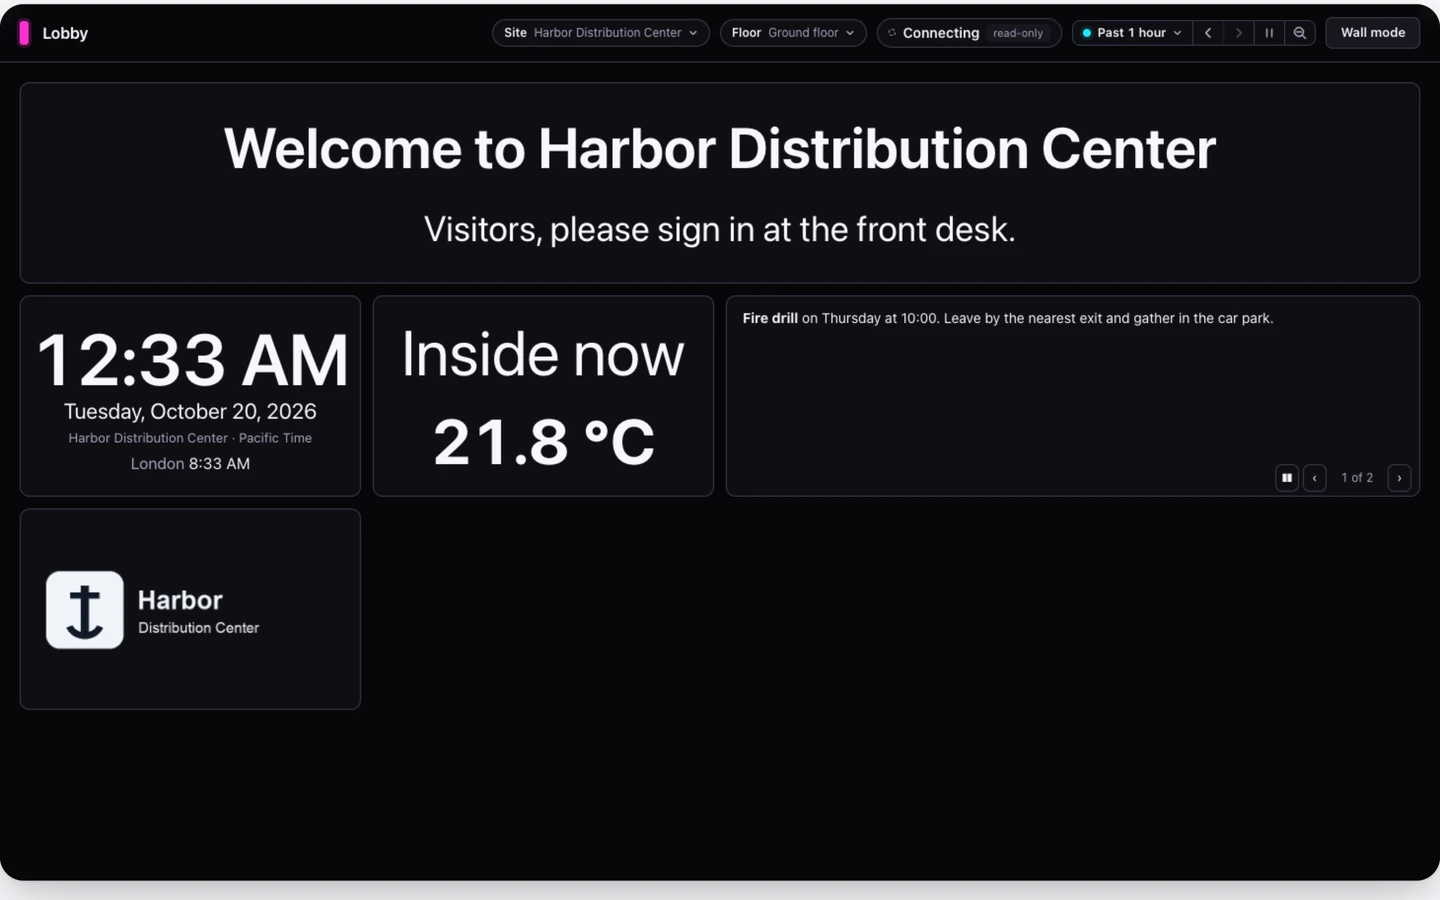
Notes, pictures and web pages on the board
Add a welcome, a logo, a web page another team runs, a clock and rotating notices.
- Notes can show live readings.
- An outside web page shows only once someone approves its site.
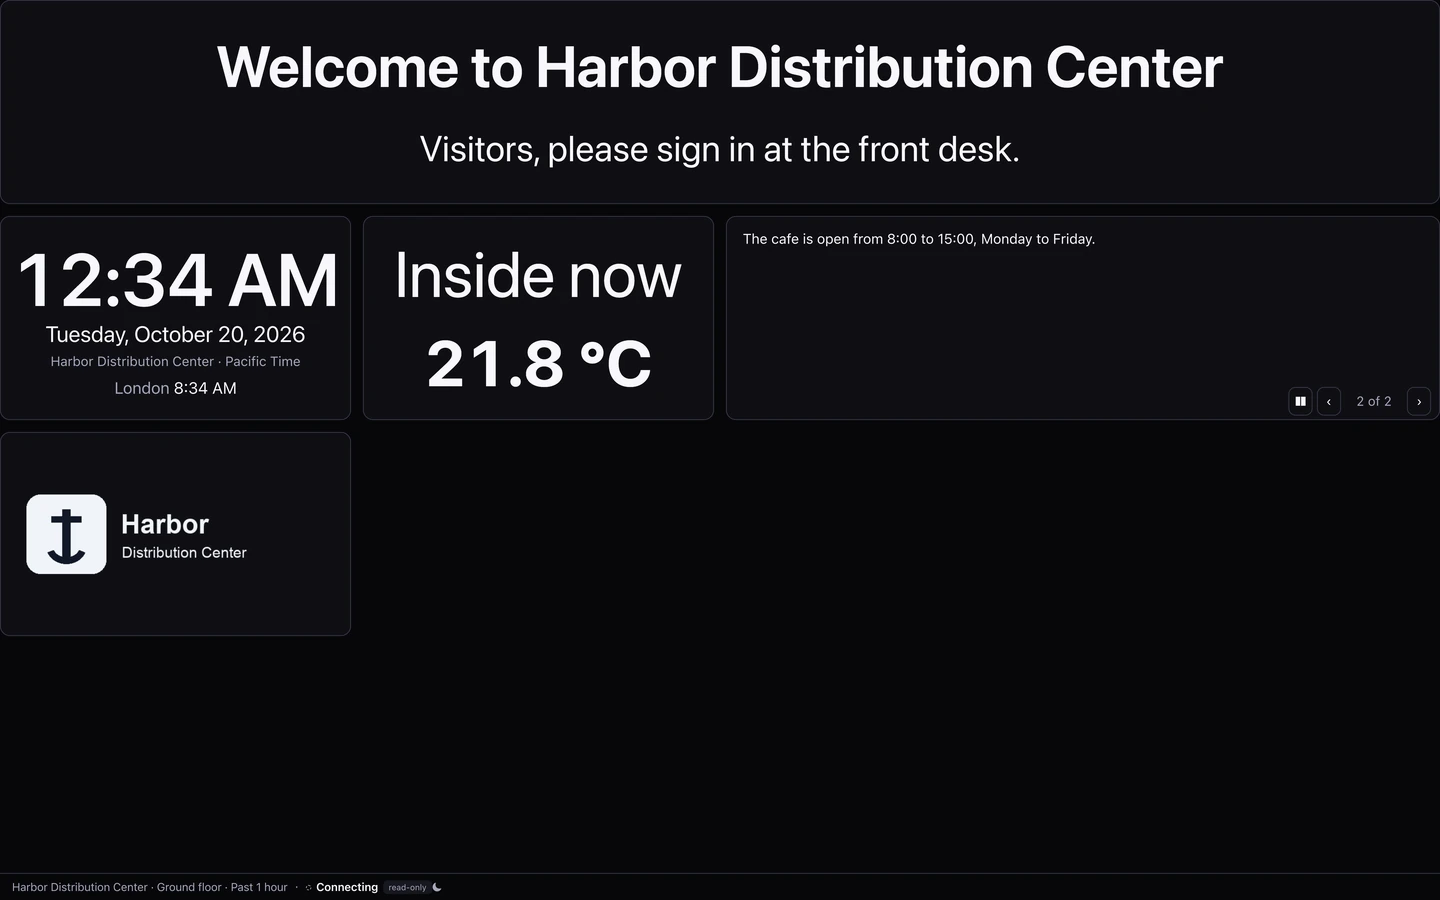
A board for the wall
Wall mode fills a big screen with the board, sized to read across a room.
- A status line always says the site, the time range and whether it’s live.
- An app with pages turns through them, each for as long as you choose.
- It’s for awareness, not a life-safety system.
Accessibility
Made to WCAG 2.2 AA, with every chart and plan also a table or a list. Not yet tested with everyday screen reader users.
-
A screen reader says: Points reporting. 11 of 12. Live. Updated 4 seconds ago.
-
A screen reader says: Chiller 1 supply temperature, image. Latest 6.1 degrees Celsius at 14:02. Lowest 5.4, highest 7.0. Below the alarm limit of 8. A table of the readings follows.
-
A screen reader says: Boiler room. Alarm. 38.0 degrees Celsius. Option 3 of 24.Arrow keys move through every place; Enter selects it.
- Status is a word and a shape, never colour alone.
- Everything works from the keyboard.
- Rivet checks every app it writes for common mistakes.