- Docs
- Dashboards and tiles
Dashboards and tiles
The tiles every board is made of, how to change one yourself, and the board's shared rules.
Every board Rivet builds is made of the same set of tiles, fed with your site's data. A gate board, a restroom panel and a fleet list are one set of pieces arranged differently.
The tiles
- Numbers: one figure that matters, with its unit, and optionally its recent history drawn behind it. A plain count, such as people counted, prints as a bare figure ("487") unless the tile names what it counts ("487 people"). A number can also say when its history peaked, under the figure: "Busiest hour 08:00 · 668". Until the history holds enough readings to have a busiest step (six hours or minutes, or three days or months), it says "Busiest hour: not enough readings yet" instead of naming one reading as the peak.
- Counts: "9 of 12 running" is told against every unit the site has, so a unit that sends nothing keeps the total at 12 and the count falls; it is never told against only the units that report.
- Tables: rows of equipment with readings, meters and statuses, up to 1,000 rows. Click a heading to sort; the download icon saves the rows as a spreadsheet file, and the tile says how many rows it saved and the file's name. Where a row opens something, such as a chart of that building's readings, its first cell is a button: press the row's name, or reach it with the Tab key, and a screen reader says what it opens ("Show readings for Terminal 8").
- Charts: readings over time, with a band behind the line for a target or a forecast. With live data on and the board showing a live time range, a chart's line grows at its end as each reading arrives, summarised the way the chart summarises (an average, a highest value, a total); paused or looking back, it shows only what was read. Where a sensor sent nothing for a while, the line breaks: that stretch is a gap, never a 0, and the lowest, highest and average over the range leave it out. A reading that really was 0, such as a fan standing still, is drawn as 0. A figure worked out from several sensors, such as a total of two meters or a PUE, is a gap too wherever one of those sensors sent nothing, so it is never worked out from part of them. A chart can ring each line's busiest hour, day or month and say it under the chart, for example "Busiest hour 08:00 · 668", in the time zone its axis shows; a line with too few readings says "not enough readings yet" and is not ringed.
- Timelines: each door, bridge or machine over the last hours, with its state now and how long it has held.
- Floor plans: the building drawn from its own geometry, with things moving on it. See Floor plans and 3D.
- Attention lists: what needs action now, across several tables, most urgent first. When more than three things need attention for the same reason, they fold into one line that says how many and what they share, for example "11 crowds · busy". The line names one of them as furthest out only when the list can tell which is furthest past its limit. On a board that also shows open work orders or service requests, Rivet puts the urgent open ones (P1 and P2 unless you say otherwise) in the list, and a table of things sorted worst first counts a thing's open urgent work, so a freezer with an open P1 job is never listed as fine.
Tiles name places and equipment as Mapped names them. Where Mapped names a place by a number alone, such as a gate's seating area called "80", the tile puts the kind of place in front, "Hallway 80", so a bar or a row never reads as a bare number beside its count.
Every tile works with a screen reader and in high-contrast mode, and says a state in words or a pattern, never by colour alone.
A board can also carry tiles that inform rather than read the building: a note, a picture, a web page from another site, a clock and rotating announcements. See Notes, pictures, web pages and clocks, and Show a board on a wall screen to put a board on a large screen.
Choose the time range
The time range in the app's header is what every chart on the board covers. A board opens on Past 1 hour, or on the range the app was made for: ask Rivet for "today" and the board opens on Today. Open the range for a ready-made one: Past 15 minutes up to Past 1 month, or Today, Yesterday, Week to date and Month to date. A past range follows the clock, so "the past hour" is always the hour up to now.
Today starts at midnight where the site is, not where you are, and is not the past 24 hours: a chart of each hour today has one bar for every hour since the site's midnight. Yesterday, Week to date (from Monday) and Month to date follow the site's calendar the same way.
The range button says what a calendar range covers so far, after its name: "Today · 00:00 – now (4 min)", "Month to date · 1 Nov – now (1 day)", or "Yesterday · 1 Nov". Early in a period there's little to show, so the board says so in a line above the tiles, for example "Today began 4 min ago, so the tiles hold little yet.", and offers a fuller view in one press: Show yesterday, Show the past week or Show the past month. It says this while Today is under 6 hours old, Week to date under 42 hours and Month to date under 7 days. The board doesn't change the range on its own.
To change the range a board opens on, ask Rivet ("open on this week"), or change The range the board opens on in the Settings tab. A range you pick yourself still wins for you.
For a stretch that is over, choose Custom range…. A small form opens with From and To, filled with the window the board shows now:
- Type or pick a start and an end. Both must be in the past, the end must be after the start, and the range can be at most 92 days long.
- Press Apply. The board pauses on that window, the header prints it, for example "17 Oct 08:00 – 12:30" (with the year, "17 Oct 2025 08:00 – 12:30", when it is not this year), and each chart's time axis runs exactly from the start to the end, even where a chart has readings for only part of it.
Anything wrong is said under the fields and nothing changes until you fix it. Cancel, or Escape, closes the form. The arrows beside the range step the window back and forward by its own length, Live returns to now, and the magnifier widens the window to twice its length, ending at the same moment. Your range is kept in the page's address, so a link to the board opens on the same window.
Whose time a chart shows
A chart's times are the site's own time, wherever you are, and the time axis names the zone at its left end, for example PDT for a site in Los Angeles in summer or UTC. The time the chart prints when you point at a moment, and the times in its table, name the same zone. A chart that spans a clock change names both, such as PDT/PST on the day the clocks go back, and each time in its table and each moment you point at names its own. When the charts must match times written in UTC, such as a table of UTC stamps for a report, ask Rivet to show the charts in UTC, or change The time zone the charts print in to UTC in the Settings tab. When a building does not state its time zone, Rivet reads it from the building's address (a US state that keeps one time zone, or a country) or from where the building is, so a Boston office shows Eastern time without being asked. A site whose buildings do not say where they are shows your own time, still named.
Which unit a temperature shows in
On a site in the United States, every temperature shows in °F, even when its sensors report in °C: numbers, charts and their axes, tables, notes, the floor plan, an equipment's readings and the wall. Rivet converts each value exactly, so 22 °C shows as 71.6 °F, and a difference such as "2 °C above its setpoint" shows as 3.6 °F. A spreadsheet saved from a table has °F in its heading, with the numbers you see. Elsewhere, each value keeps the unit its sensor reports.
A limit you set keeps the unit you wrote it in. When a board shows another unit, the limit is shown in both, for example 80.6 °F (27 °C), and a reading is graded against it exactly.
To keep the sensors' own units on a US site, such as °C for a laboratory, ask Rivet to show temperatures as the sensors
report them. Rivet saves that as a setting, The units temperatures are shown in, which you can change in the
Settings tab: stated keeps the sensors' units, us shows °F and metric shows °C on any site, and site goes back to
°F in the United States.
Some sensors don't say which unit they report in. Their values show as they are, with no unit, and asking for °F doesn't change them on its own. When the numbers plainly are °C, ask Rivet to treat them as °C: it then converts them like any other and shows the unit beside each value, and it says on the board that it assumed the unit. When Rivet can't tell, it says which values stay as they are before it changes anything.
A count of temperature readings, such as how many readings a sensor sent today, is a plain number and shows with no unit. A change over a period, such as how much the supply air rose today, converts as a change: a rise of 2 °C shows as 3.6 °F, never 35.6 °F. When some sensors in a table's column say their unit and others don't, each value keeps its own unit: on a board in °F, one in °C shows in °F, and one with no unit shows as it is read, never in another sensor's unit.
Calendar months, reading times and every reading
Some questions are about the calendar or about a single reading, and standard tiles answer them; no custom tile is needed.
- Calendar months. A tile can keep its own window in calendar months: this month so far, or this month and up to the two before, each from the first of the month at midnight in the site's time zone (or in UTC when the charts print in UTC), as Month to date is. Stepped by month, a chart draws one bar per month and a table lists one row per month. For a meter that counts up, such as energy or water, each month is its end reading less its start reading. A number can say how this month so far compares with the same days of last month, and says "vs the same days last month": on the evening of the 1st it's the 1st against last month's 1st up to the same time, never against all of last month. Hold the pointer on the change to see the span it compared. When last month has no reading for those days, the tile says so, and when its readings start later in the month, it says "can't compare with the same days last month: readings start 25 Oct" instead of a change. Stepped by day, a number compares today so far with the same hours of the day before.
- Days. Stepped by day, a chart draws one bar per day and a table lists one row per day, each day from midnight in the site's time zone (or in UTC when the charts print in UTC), such as "Sat 31 Oct 2026, PDT". For a meter that counts up, each day is the reading at the next midnight less the reading at this one, so the days of a month add up to the month. The day the clocks change is 23 or 25 hours long, as it was at the site.
- Hours and shorter steps. For a meter that counts up, each hour (or each 5 or 15 minutes) is the reading at the start of the next hour less the reading at the start of this one, so the minutes between one hour's last reading and the next hour's first are counted, and the hours add up to the day and the month.
- A reading's date, time and time zone. A table column can show when each reading was taken, such as "2026-10-31 07:35:58 PDT", in the site's time zone or in UTC, instead of how long ago. When you save the table, the file writes each time in full, in UTC. When none of the rows has a reading for a column that shows how long ago, the table leaves that column out and says so once under its title, such as "Run status read: no row has a reading", instead of writing "no reading" in every row.
- Every reading at its own time. Over the last six hours or less, a chart can draw each reading as it came, and a table can list each one with its exact time, to the thousandth of a second, and the time zone, with a column for each sensor.
Ask Rivet for any of these in your own words, such as "this month to date against last month" or "show the time of each reading with its time zone". In the tile editor they are under Time (calendar months) and Step (calendar month, each reading), and in a table's columns (Date and time).
Point at a moment on every chart
Move the pointer over any line or bar chart and the same moment shows on every chart on the board: a dashed line at that time and what each line reads then. You can see at once what else was happening when the temperature climbed. A chart whose window does not include the moment shows nothing.
Where the values appear depends on how wide the chart is, not the screen:
- A wide chart lists them on the half of the chart away from the pointer, so they never sit under it. When there are more lines than fit, the list's last row says how many more, for example "+5 more · click to pin and scroll" ("tap" on a touch screen).
- A narrow chart, on a phone or in a small tile, shows them in a band above the chart, with the time first. While nothing is pointed at, the band shows each line's latest value. When there are more lines than fit, scroll the band.
To keep a moment while you look, click the chart (or tap it on a touch screen). The dashed line turns solid on every chart on the board, the values stay when the pointer moves away or crosses another chart, and a long list can be scrolled. Click or tap again, on any chart that shows it (on its list too), to let it go everywhere. A chart whose window does not include the kept moment shows nothing of it: the pointer crossing it leaves the moment alone, and a click there keeps a new moment instead. A kept moment goes on its own only when no chart on the board shows it any more, because their windows have moved past it. Press Esc to put the values away, kept or not, without moving the pointer.
On a touch screen, drag a finger along a chart to read it: the values follow your finger and stay where you lift it. Swiping up or down, on the chart or on its band of values, still scrolls the page, and two fingers still zoom it.
With a keyboard, press Tab to reach a chart, then:
- Left and Right move through time, one reading in the chart's window at a time, or ten with Shift, Page Up or Page Down. Home and End go to the first and last reading in the window.
- Up and Down move between lines on a wide chart, and through time on a narrow one.
- Enter lists every value, on a wide chart that only has room to show the nearest line.
- Space keeps the moment or lets it go, and Escape clears it.
A screen reader hears the chart as a slider called "Time on the chart": its value is the time and what the lines read then, and it says when a moment is kept, let go or cleared.
Drag to zoom in
On any line or bar chart, press the mouse button at the start of the stretch you care about, drag across it and let go. The whole board narrows to that stretch and pauses on it, the same as a custom range. While you drag, the other charts follow the end of your selection.
- A click, or a drag of a few pixels, keeps the moment instead (see above).
- Escape while dragging drops the selection.
- A selection shorter than a minute is widened to a minute around where you dragged.
- With Arrange on a drag moves a tile instead, so charts do not select then.
- On a touch screen, a finger dragged along a chart reads its values instead (see above). Use Custom range… to zoom.
- Without a mouse, Custom range… does the same job with the keyboard.
To get back, press Live, choose a ready-made range, or use the magnifier to widen the window.
A tile's corner buttons
Hover a tile and two round buttons appear in its top right corner, side by side:
- Show full screen, on the left, opens the tile over the whole page. The same button, its corners now turned inward, closes it, and so does the Esc key.
- i, on the right, turns the tile over to its back: where its data comes from, the graph behind it, its links, what it reads and, under that, whether some of its rows are located at the site rather than on a floor. The i becomes an × that turns it back.
On an app with an assistant, a third button, ✦, sits left of them: it opens the assistant with the tile in its message box (Ask about a tile).
On a touch screen, with no hover, the buttons are always there. The corner holds only these buttons: a tile's status, such as a Warning pill, sits right after its title, and wraps under it on a narrow tile. While a tile is full screen its close button stays, even when you turn the tile over.
A board you have opened before opens with its last values
Open a board you have opened before, in the same browser profile, and it doesn't start as a grid of spinners. Its cards draw the values they showed you last time while Mapped is still answering, and fill in the fresh ones one card at a time. A card built on a dataset draws at once. A card that finds its points by type draws as soon as Rivet has looked them up; that lookup asks Mapped, so it can take a moment, most of all just after the app has restarted.
- A small ring sits in the corner of every card showing last time's values. It means the values are the last ones you saw and are being refreshed now. It isn't a problem: the header doesn't count it, Try again isn't offered, and it goes when the card's fresh values arrive. Its name, which a screen reader reads out, is "This card is showing the values it had last time, which may be hours old; it's refreshing now".
- Press the ring and Requests to Mapped opens at that card and says the same in a sentence. On a wall screen, or while you arrange the tiles, nothing can be pressed, so the ring is all there is.
- If the refresh is slow or fails, the card keeps its last values and says so as it does for any card showing older data: an amber dot, "Some of this card's data is late" or "showing older data". See When a card can't load.
- A card that already says how old its reading is goes on saying it. A card that says nothing about age today says nothing more: the ring is what tells you its values aren't fresh.
- There is no age limit. Values are drawn however old they are, because nobody knows yet how old is too old; a board you last opened a month ago opens on a month-old picture, ringed, until the fresh one lands.
- A board that hasn't been opened in this browser profile loads as it always did, with spinners.
- After you change an app, its readings still open on the values they showed before, ringed, because a sensor's last reading is the same whatever the board around it asks. A card whose question changed, such as a new table or a count with a new rule, starts with a spinner, because its old answer was for another question.
What Rivet keeps for this is the answers to the questions your board asked, such as a table, a number or a chart's lines, and never a copy of your building's data. It keeps them where the app runs: on your computer in Rivet and the desktop app. A Docker image keeps them in memory, so a restart starts every board cold again, unless whoever runs it gives the app a folder to keep them in. This holds for the tiles on every page of every app, whatever it started from. A plan's own cards outside tiles, such as its side panel, aren't part of this: they have no corner to say a value is old, and their slowness is the floor plan and the models, which Rivet holds another way.
Tiles and the floor menu
On a site with more than one floor, the app has a floor menu whenever something on the page follows it: a floor plan or 3D view, or a tile that names no place of its own, which reads what is on the chosen floor. A board whose tiles all say where they read (one or more buildings, a floor, a room) has no floor menu, and its header and wall show the site, so it never names one floor over readings from several buildings. Equipment that Mapped records against the whole site rather than a floor, such as the air boxes of a warehouse, counts on the floor of the room it serves, when Mapped says which room that is. Equipment that serves no room stays in the tile's rows whichever floor is chosen. The tile's face says nothing about it; its back, under what it reads, says how many, for example "chillers: 3 rows are located at the site, not on a floor".
All floors. On a board with no floor plan or 3D view, the floor menu's first choice is All floors: a tile that names no place then reads every floor of every building. A board on a site of more than one building, such as an airport's two terminals, opens on All floors, so a board asked for across buildings never reads one floor of one of them without saying so. Pick a floor from the menu to narrow every such tile to it; the app remembers your choice. When you ask about some of the buildings by name, Rivet makes each tile read just those, and the board then has no floor menu. A page with a floor plan or 3D view always shows one floor, and offers no All floors.
Some readings still have no floor. When the chosen floor holds none of a tile's readings but some of them have no floor, the tile reads those across the whole site rather than showing nothing, and says so in the line under its title, for example "Reads 1 point site-wide over the past 1 hour (these have no floor)". A tile with several graphs says "site-wide: these have no floor" in its notes. A tile never borrows another floor's readings: when they are all on other floors, it reads none on the chosen floor and says which floor. A floor plan tile always draws the chosen floor.
Pick the lines a chart draws
A chart with several lines has a key above it, one name per line, each in its line's colour. The key is also how you choose which lines are drawn:
- Press a name while every line is drawn, and the chart shows that line alone. The other names stay in the key as outlines in their own colour, with no fill.
- Press an outlined name to add its line back. Press a filled name to take its line away. Taking away the last line drawn brings every line back.
- The value axis fits the lines drawn, so a line alone fills the chart's height.
- A line that appears while you have picked some, a new air box for example, stays hidden until you add it.
- The values at a moment list only the lines drawn.
When the key is longer than its row, its last item says how many more there are, for example +5 more. Press it and the tile opens full screen with every line in a list under the chart: its average, lowest, highest and latest value, in the chart's units. Type in Filter series to find a line by name, and press a column's heading to sort by it. A row presses like a name in the key. The box at the head of the list shows whether every line listed is drawn, some (−) or none; press it to draw every line again. A band, such as a normal range, keeps its name above the chart. Press Esc to close full screen; the lines you chose stay chosen.
What you choose is yours: it lasts while the page is open, also when you change the time range, is not saved into the app, and is not remembered after a reload. A chart with one line has nothing to choose.
How old a number is
A number tile keeps its face for the figure. To see when its reading was taken:
- Hover the number: it says when it was read and how it came, for example "Read 30 s ago, 02:07:30 · checked every few seconds", or "pushed by the live stream" with live data on.
- Turn the tile over with its i: the back has the same words in its Reading row. This is how a touch screen reaches it.
- On the face, the age appears only when the reading is older than the time range the page (or the tile) shows: a value from before Past 1 hour on a one-hour page says how old it is.
- A point that has never reported says no reading.
An age is never shown in colour or as a warning: many building sensors report only when their value changes, so a reading from twenty minutes ago often comes from a building that is working fine.
When a board says whether a sensor's reading is fine, Rivet first looks at how often that sensor has reported over the last six hours, and a reading older than that sensor's longest usual silence reads stale, never ok. The limit is a setting you can change, and its note in Settings says how often the sensors reported when Rivet looked. Setpoints and other values that are sent only when someone changes them are never called stale.
When a page is looking back at an earlier moment (see Look back in time), the words count from that moment: "Read 1 min before 14:32:05 UTC, 14:30:40" in place of "Read 1 min ago". A reading taken after that moment still says how long ago it was from now.
Counts of things
A number that counts things, such as forklifts running or doors free, is always a whole number, and it is the same number as the list or table beside it that it counts. When it changes, it counts up or down to its new value in whole steps; when it changes again quickly, as a count of moving things can several times a second, it shows the new value straight away.
A moving thing is not reporting only when nothing has been heard from it lately, at the point where the plan fades it. A forklift heard a second ago whose latest update carried no speed is still reporting: only its speed was not measured that time.
Take one plan tile back in time
A plan tile on a board has its own small time control, whose slider reaches across the board's time range. Move it and only that tile goes back: its moving things, readings and stamp stand at that moment, and the rest of the board keeps going. The tile's header then says the moment and the way back, right after the tile's title:
- Back to live, when the board is live. Press it and the tile returns to now.
- Follow the dashboard, when the board is paused. Press it and the tile goes back to the board's own time.
The app's header speaks for the whole board, so it keeps saying ● Live while one tile looks back. It says Reviewing only when the whole page does (Look back in time).
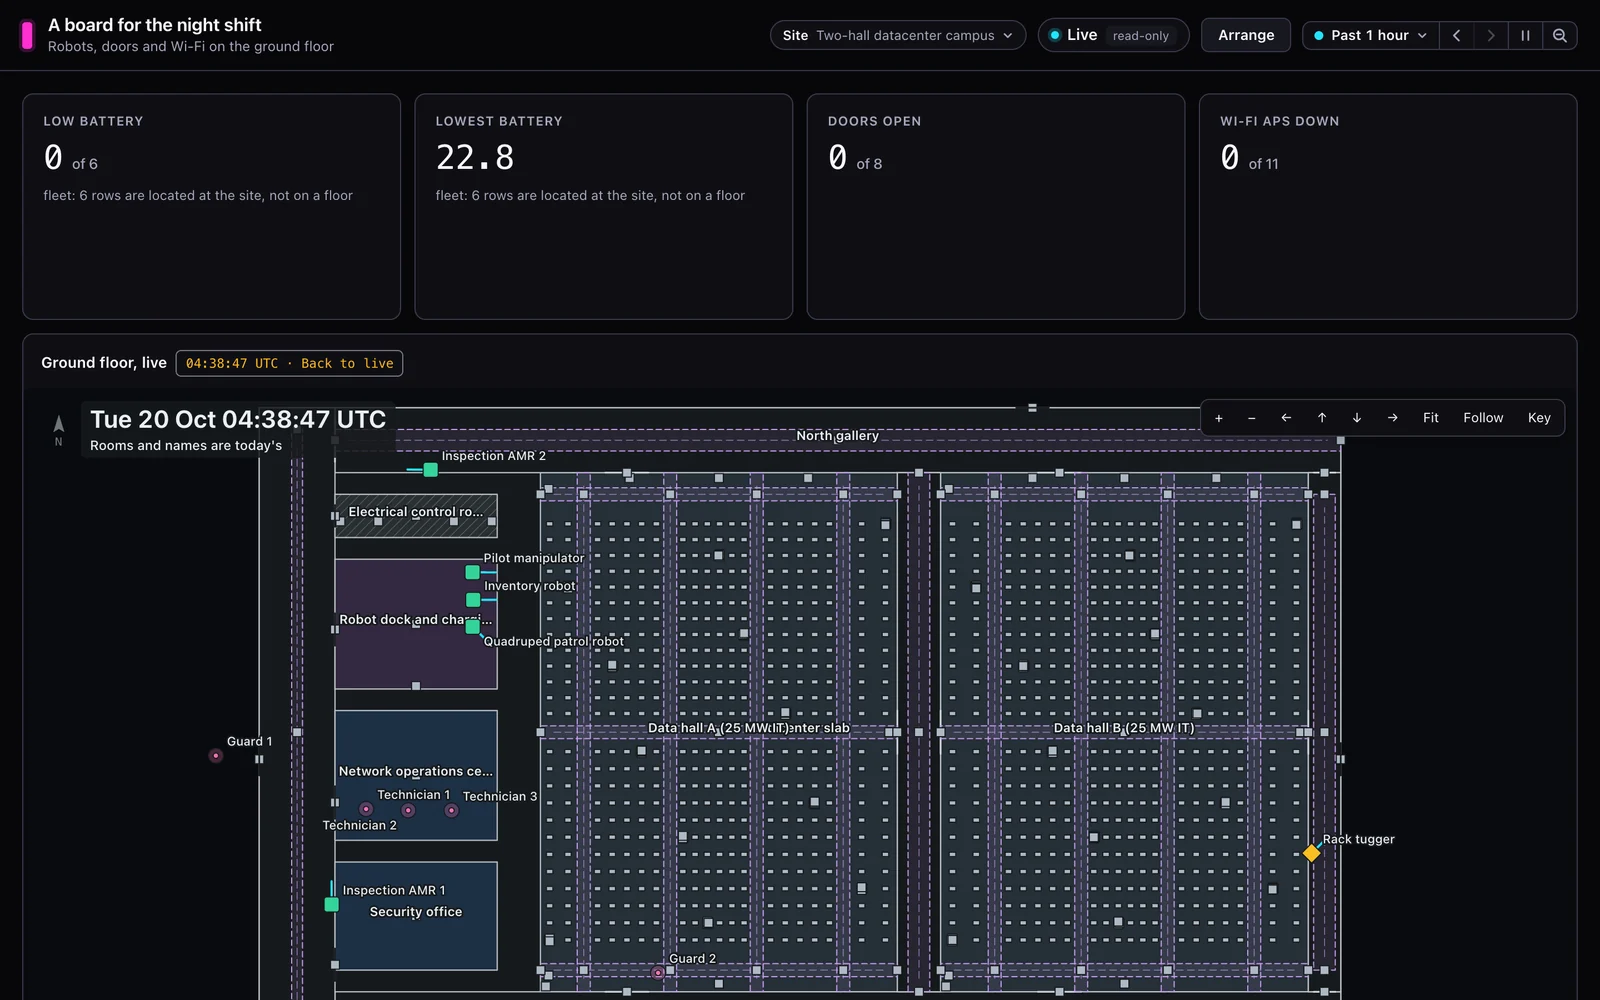
A plan tile has this control only when the tile reads its own moving things or readings. A plan tile drawn from what the rest of the board reads, or one showing only rooms and equipment, has none: it follows the board's time.
Move and resize tiles
Until someone arranges a board, each tile goes in the first space it fits, so the board has no gaps: four small numbers fill the space beside a tall one instead of starting a row under it. On a narrower window a tile widens to fill its row, and shows its own width again while you arrange. Once you arrange the tiles, the board keeps them where you put them, gaps included.
To reorder or rearrange the tiles in a shared copy of a dashboard, press Arrange in the app's header. While it is on:
- Drag a tile to move it, and pull its corner to resize it. On a touch screen, drag a tile by its head.
- To make a tile in the bottom row taller, or move a tile lower, hold its corner or the tile at the bottom of the window: the page scrolls down with it. Two empty rows under the board show where it can go.
- Or focus a tile: the arrow keys move it, and Shift with the arrow keys resizes it.
- Reset, in the bar above the tiles, puts the tiles back where the app placed them.
Press Arrange again when you are done. While it is off nothing moves: a scroll or a tap never drags a tile. The arrangement is yours: it is remembered for this app in your browser, and nobody else's board changes.
In Rivet, Arrange is in the toolbar instead, and the arrangement you make there is saved into the app, so everyone you share it with starts from it.
Change a tile yourself
Click a tile's i to turn it over and read what it shows. In Rivet's preview, a tile that describes what it reads (most of them) has an Edit tile button on its back. It opens the tile editor, where you can rename the tile, change its columns or its limits without asking Rivet. Its display options set Unit shown, the word printed beside every value ("people" instead of a sensor's own label); between watts and kilowatts, watt-hours and kilowatt-hours, pascals and kilopascals, or litres, gallons and cubic metres the values are converted too, and any other word only renames. Decimal places sets how many decimals every value shows, and on a chart or a number, Show when it peaked calls out the busiest step by its time, named by Peak called ("Busiest hour"). On bars, a ranked list or a table, Order says how they are listed. Bars and tables that group by floor list the floors lowest level first, whatever the order they were read in; By floor says so outright (and puts a ranked list's few in floor order), By value lists the highest first, and Automatic leaves a ranked list ranked by value. Ask Rivet for it in the same words: "sort the bars by floor". To add a tile, use Add tile above the preview; its Inform group holds the note, image, embedded page, clock and announcements. For anything else, press Ask Rivet to change this tile in the editor: it closes the editor and puts the tile in the chat, as Inspect does, so the chat box is left for you to say what to change.
When Rivet asks before writing a custom tile
Most tiles are ready-made: they describe what they read, so you can open them in the tile editor and change them yourself. A tile Rivet writes as code, a custom tile, can do what no description can, but costs more to keep. So on every board, in any app, Rivet first tries every ready-made way to build the tile, and only when none can do it does it ask you, with a card in the chat that asks, for example, "Make "Energy use intensity" a custom tile?":
- Why a ready-made tile can't: what you'd miss with one of Rivet's ready-made tiles, such as each building's floor area beside last year's figure.
- What I tried: each ready-made way Rivet tried, and why it fell short.
- What changes for you: what you give up. You can then change only the tile's title, description and links yourself; anything else, such as what it shows or how it looks, you ask Rivet to change; when Rivet improves its ready-made tiles, this one won't get the improvement; and, where it applies, whether it changes with the floor you pick and with the page's time range. When the tile it replaces is a table, the card also says that its download button and the names you can press stay only because Rivet builds them into the tile, and Rivet does: the rebuilt table saves the same spreadsheet file, with units in its headings and each time written in full, in UTC.
- What it costs in AI usage: what making it should cost and what each later change should cost, from what Rivet's earlier work has cost. While Rivet has made few custom tiles, the figure comes from what its changes, or this app's own, have cost; when it has no work of its own yet, it gives its usual figure. The card says which in brackets after the figure.
Press Yes, make it for me to let Rivet make it, or No, keep the ready-made tile to keep what you have. Under the two buttons, one line each says what you get: with Yes, make it for me, the tile you asked for, and Rivet makes any later change to it for you; with No, keep the ready-made tile, the tile you have now, without what's missing, which you can still change yourself. You can also answer in your own words: a plain yes, such as "Yes, do both", counts as Yes, make it for me, and a plain no, such as "No, keep it as it is", counts as No, keep the ready-made tile. After a yes you can go on to say what else you want, such as "Yes, make it. And leave the shopping carts out.": the yes counts, and Rivet does the rest too. Anything else, such as a question or a yes with a condition ("Yes, but only the table"), leaves the question open, and Rivet cannot write the custom tile until you choose. If Rivet asks in its reply whether to make a custom tile and you say yes in your next message, that yes counts: the card it shows next says You agreed in your message with your words, and Rivet makes the tile without asking again. When Rivet asks again, the earlier card keeps what it said and loses its buttons, so the newest card is the one to press. Once a tile is custom, later changes to it need no new question. Turn into code in the tile editor, once you Confirm it, is your agreement too, so Rivet asks nothing more.
A custom tile can read every reading of up to 40 sensors over the last day, such as each trailer's visits at the dock doors since this time yesterday. A day is as far back as it reads every reading. Over a longer stretch Rivet reads hourly or daily summaries, which a number such as a temperature or a meter has and an on-or-off reading, such as a trailer being at a door, doesn't; so a trailer's visits go back a day, not the weeks a detention dispute can need.
The board's rules
A board's rules live in one place. When Rivet builds a table of your equipment, it records the readings, what is worked out from them and the verdicts your settings decide, like "warm above 50 °C". Every tile on the board reads that same table, so changing one rule in Settings changes every count, list and table at once.
What a board remembers
What you choose in an app is remembered for that app in your browser, also after a reload: the site, the floor, the page you had open, whether the page list is folded, a page's own range or site you changed on that page, the side panel's tab, a side panel you hid, the tab you picked in a row of tabs, a table's sort, the time range, a tile's view, your arrangement of the tiles, the plan's layers and hidden rows, the 3D view's options and camera angle, the zoom on a wall, and live off. In a Docker image, the app's server keeps these; a replaced container without its data folder forgets them. The lines you pick in a chart's key are not kept: a reload draws every line again.