- Docs
- Your first app
- 4. Read your board
Step 4: Read your board
A tour of the board Rivet built, tile by tile, and what each one tells the person on duty.
Here is the whole board from our run, top to bottom.
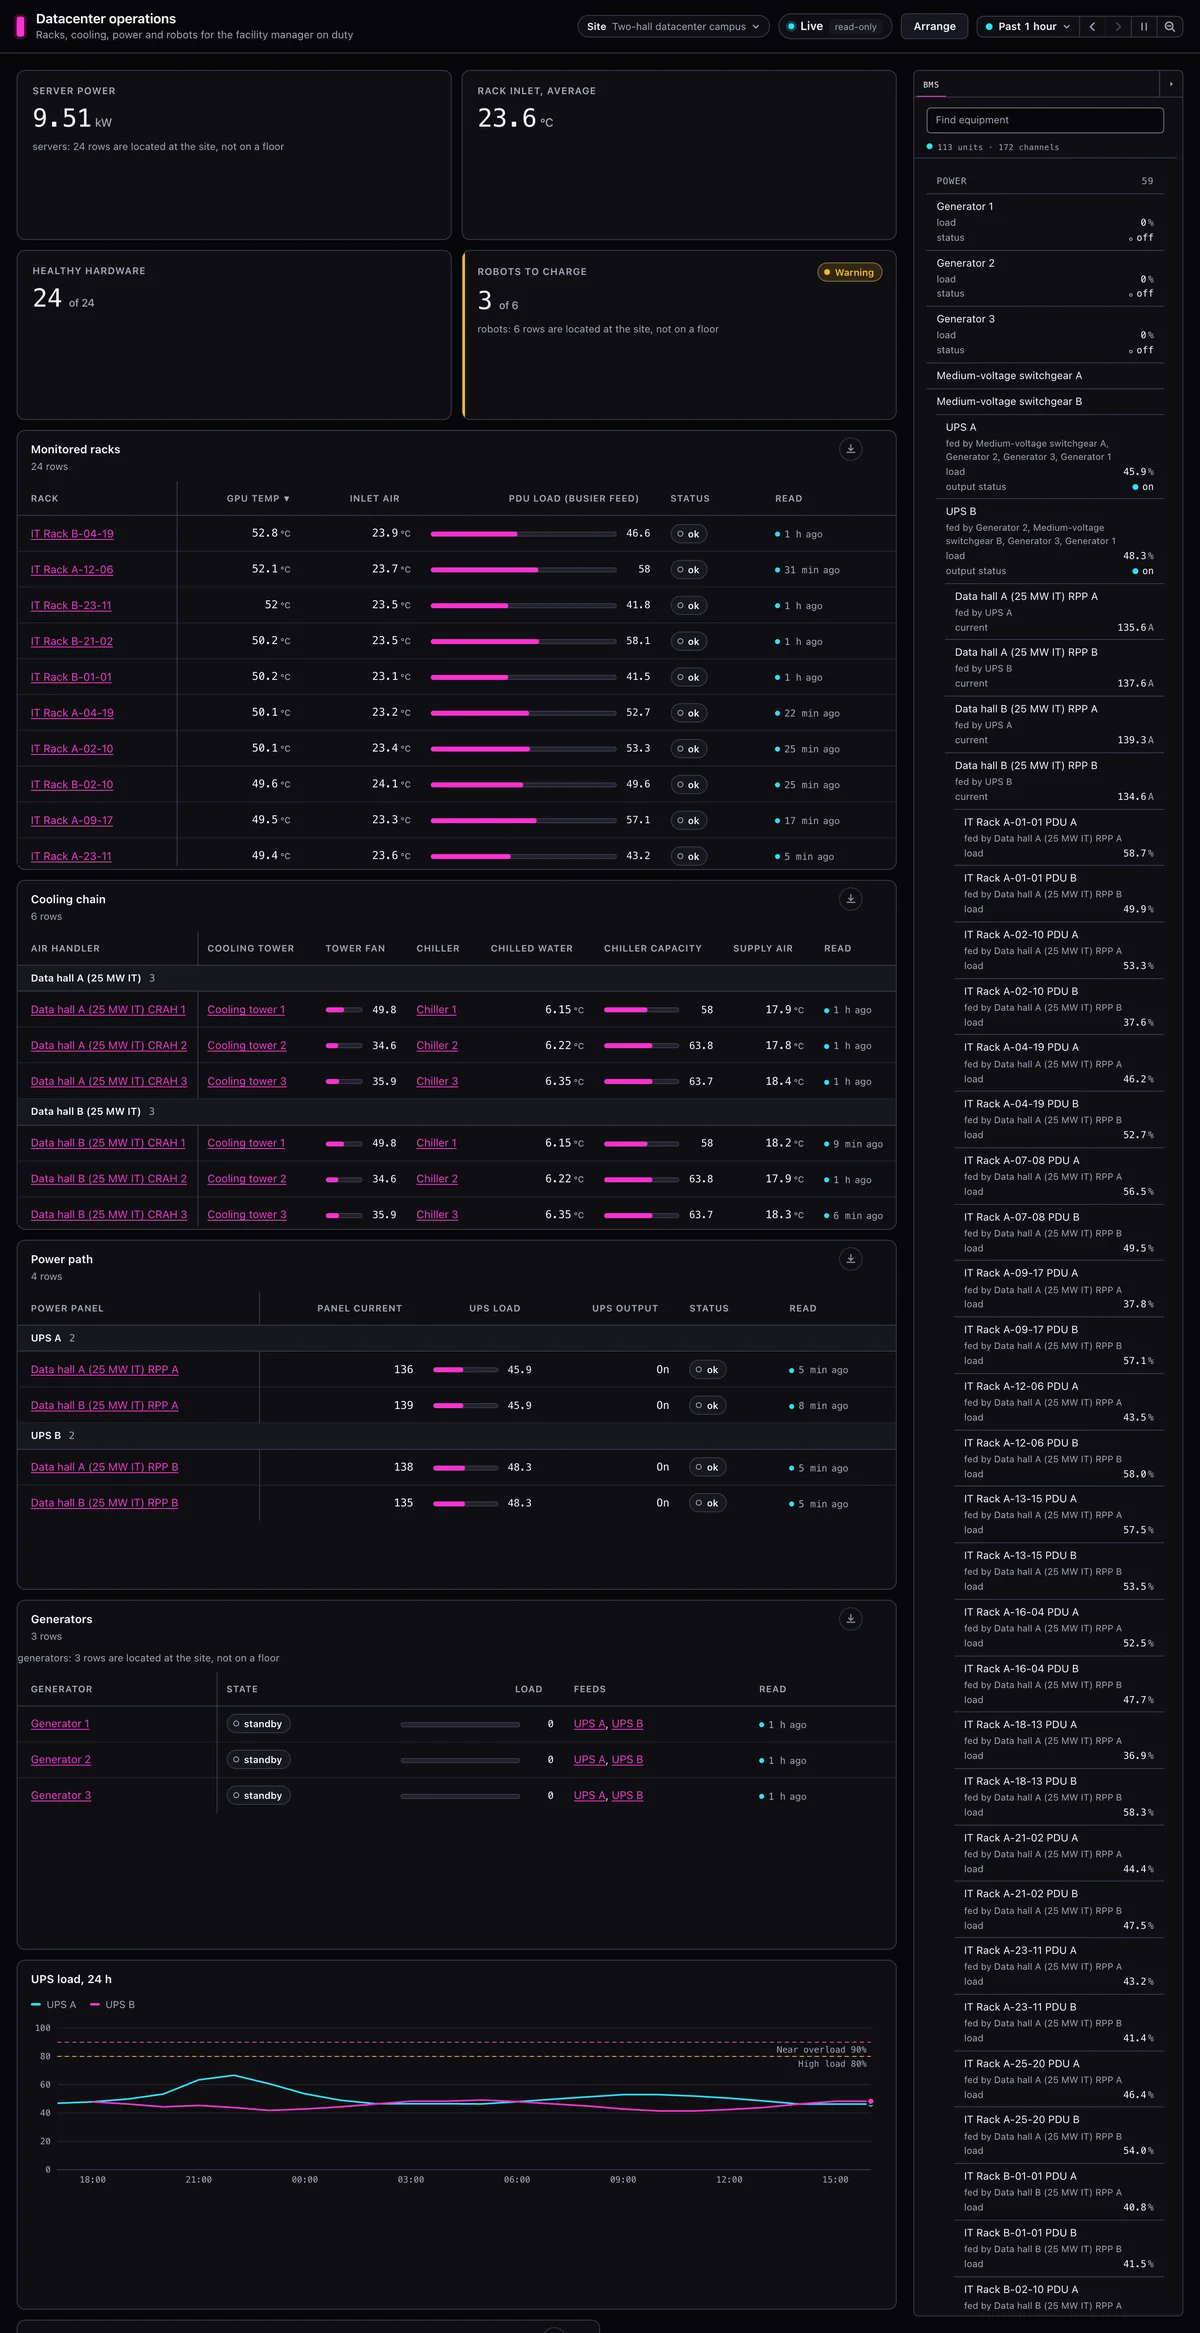
The header
The title and a line saying who the board is for. Beside them: the site (you can switch it), Live (readings are arriving as they happen; press it to turn live data off for this app), and the time range the charts cover, Past 1 hour, with arrows to step back in time, a pause button, and a Custom range… entry for any stretch in the past (see Choose the time range).
Headline numbers
- Server power: the power drawn by every monitored rack server, added up. 9.51 kW in our run on 2026-10-16.
- Rack inlet: the average temperature of the air going into the monitored racks. Rivet checks it against ASHRAE's datacenter guidelines: amber above 27 °C, red above 32 °C.
- Healthy hardware: how many monitored racks report that their controllers are healthy: 24 of 24 in our run.
- Robots to charge: robots below 30% battery. In our run three of the six were low, so the tile turned to its warning colour.
Hover over any tile and click i to read what it shows and where its numbers come from.
Monitored racks
Every monitored rack, hottest GPU first, with the air going in, how loaded its power strip is (the bar), its hardware status, and how long ago it last reported. Click a column's heading to sort by it, and again to flip the order. The download icon saves the table as a spreadsheet file.
Cooling chain
Each hall's air handlers, grouped by hall, with the cooling tower and chiller that feed them: the tower's fan speed, the chilled water temperature, how much of the chiller's capacity is in use, and the air the handler supplies. Follow a row from left to right and you follow the cold.
Power path
Each power panel with the UPS that feeds it, the UPS's load and output, and the current the panel is drawing. Below it, Generators lists the three generators, each on standby, with their load and the UPSs they feed, and UPS load, 24 h draws one line per UPS over the last day.
Robot fleet
Further down, every robot with its battery level. Those under 30% are marked needs charging.
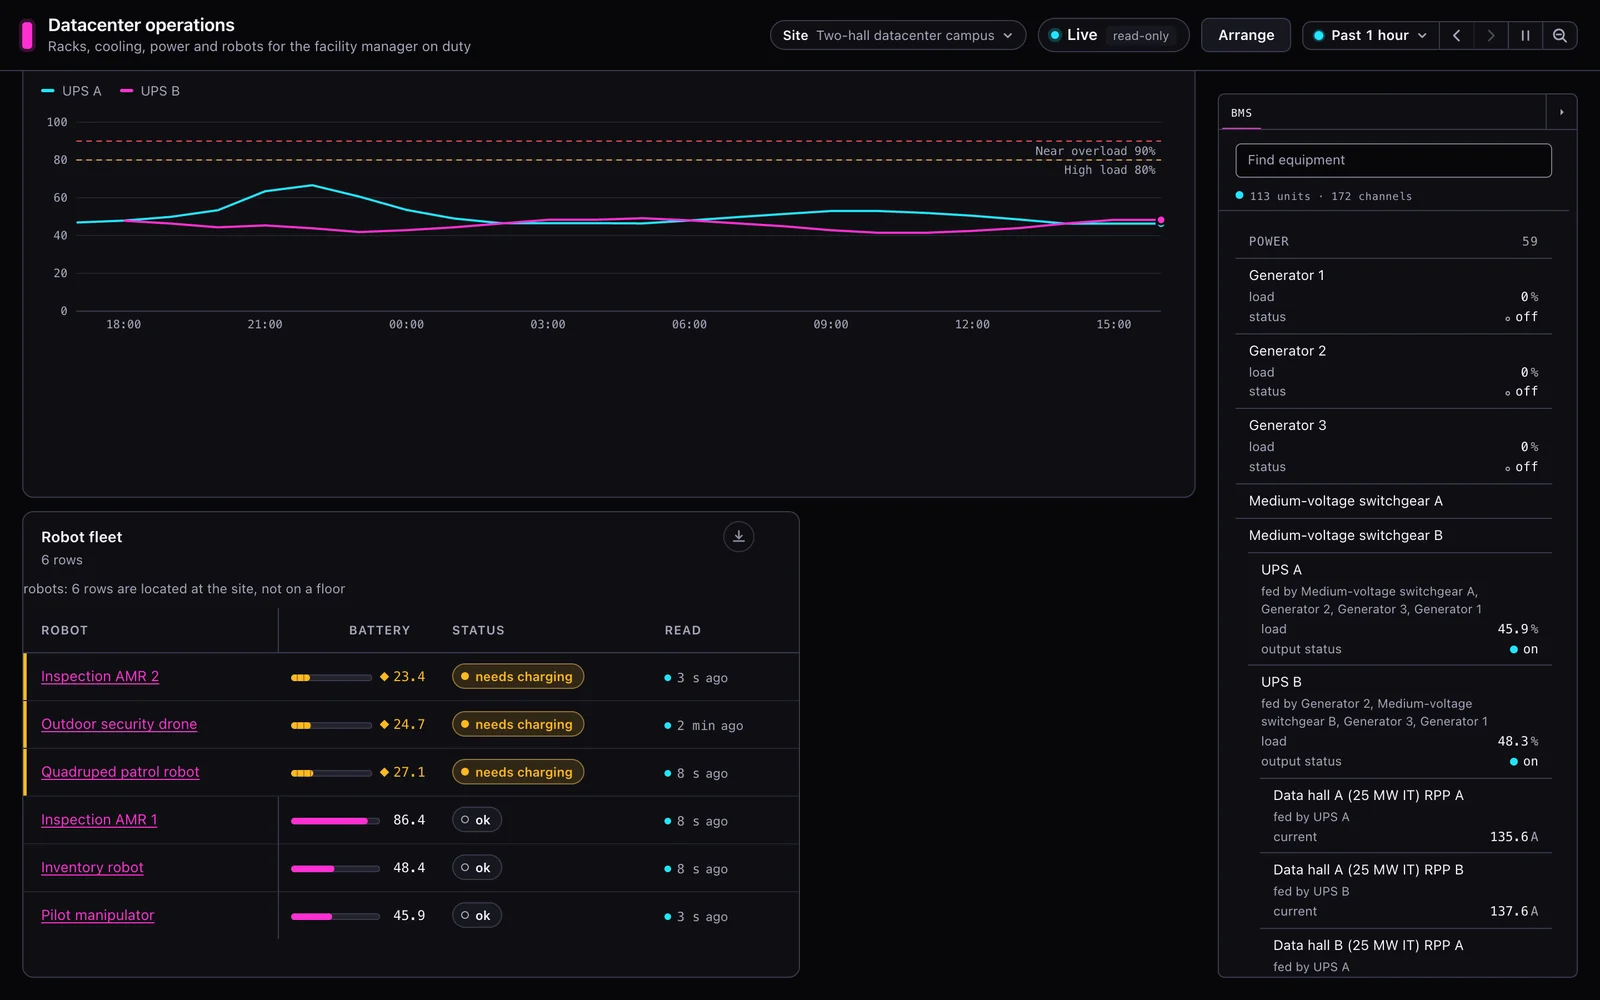
The equipment list
On the right, Rivet adds a list of all the site's equipment with its latest readings, grouped by system. Type in Find equipment to look one up.
Next: add a live floor plan.