- Docs
- Your first app
Your first app
Build a live operations board for a datacenter, step by step, with the exact words to type.
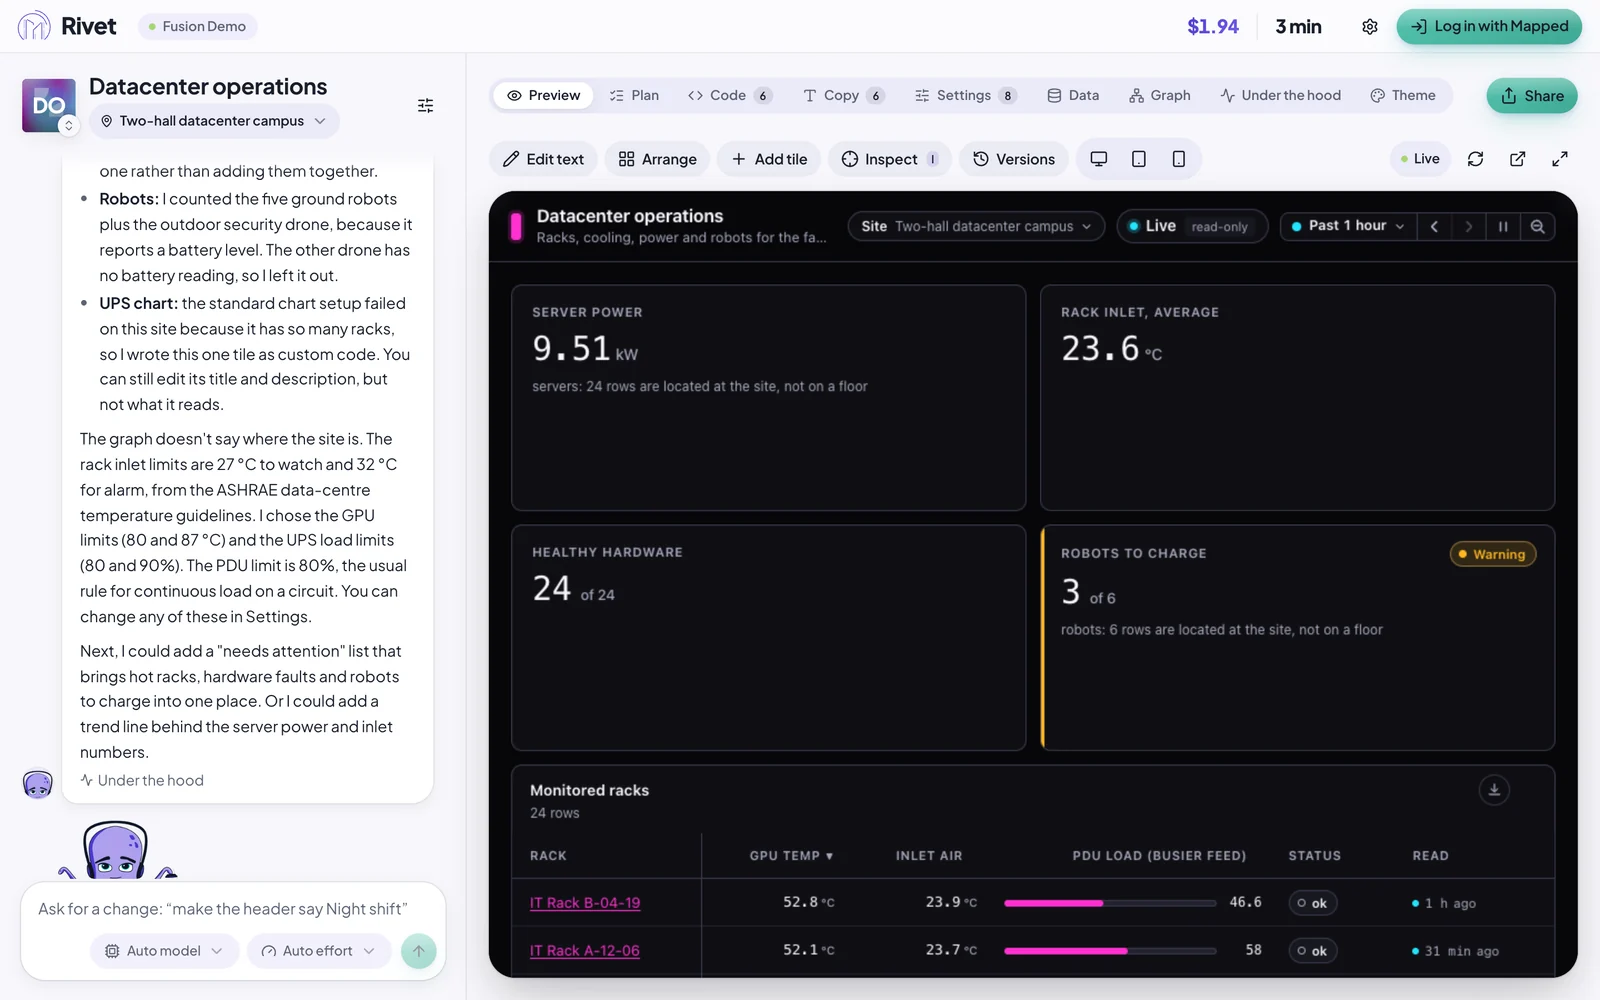
In this tutorial you build a live operations board for a real-looking datacenter: the kind of screen a facility manager on duty keeps open all shift. It shows:
- Four headline numbers: how much power the servers draw, the average temperature of the air going into the racks, how many racks report healthy hardware, and how many robots need charging.
- The hottest racks, with their GPU temperature, inlet temperature and power load.
- The cooling chain, from the cooling towers to the chillers to each hall's air handlers.
- The power path, from the UPSs to the power panels, with the generators on standby and a 24-hour trend.
- The robot fleet, with every robot's battery.
- A live floor plan of both data halls.
Before you start
- Rivet is installed and set up: see Get set up.
- You logged in with Mapped, so you can open the Fusion Demo org.
- Some time to watch: in our run on 2026-10-16, Rivet built the board in three and a half minutes. Yours may take more or less time, since Claude doesn't work the same way twice.
Where the data comes from
The Fusion Demo org is a set of example sites that Mapped runs for everyone to learn on. Its Two-hall datacenter campus has two 25 MW data halls full of racks, chillers, cooling towers and air handlers, UPSs, generators and power panels, and a small fleet of robots, a rack tugger and an outdoor security drone. Its readings are live, so your board moves the way a real one would.
The steps
- Choose the site and what to start with
- Describe the board
- Watch Rivet build it
- Read your board
- Add a live floor plan
- Make it yours
- Share it: not yet. Rivet is single-player for now, and this step comes back when exporting does.
- Step 1: Choose the site and what to start withPick the Fusion Demo org and its datacenter site, look at what the site holds, check that live data is on, and choose Dashboard.
- Step 2: Describe the boardChoose Describe it, paste one description of the whole board, and start the build.
- Step 3: Watch Rivet build itWhat you see while Rivet plans and writes your board, and how to stop or undo it.
- Step 4: Read your boardA tour of the board Rivet built, tile by tile, and what each one tells the person on duty.
- Step 5: Add a live floor planAsk for a change in plain words: a live floor plan with the robots, the rack tugger and the drone moving.
- Step 6: Make it yoursRetype words in place, point at a tile to change it, adjust its limits, and change the look, with no prompt at all for most of it.